Increasing Profits for Aspen Dental by Improving the New Patient Flow (CX)
Background
A friend of mine told me about the local Aspen Dental up the street: how they had been having nonstop problems since they’d opened a few years prior (he had been transferred there, as a clinician/provider to help out).
I asked for details.
According to him, the office was “cursed”.
The patients weren’t happy, the staff was constantly turning over and they had gone through several dentists over the years. No matter what the management team tried, nothing seemed to get this office up and running in a positive (read: profitable) manner.
This is the case study.
Problem Statement
Struggling to meet basic office revenue metrics, a local Aspen Dental contends with pressure from corporate, problems with staff turnover and low case acceptance from patients.
Big question: What’s going on with this dental office?
UX Research

I asked the obvious questions of the key stakeholders:
What were their goals as an office this year?
What did they consider the cause of the problem?
How would they define “success” for the office?
What part did improving user/patient experience play into their goals and strategies?
Key insights
Theme 1: Profits first approach
The business goals of this office were entirely focused on increasing profits and revenue (with no regard to patient wants/needs).
Metrics used to “gauge success” were: Office production (dentist + hygienist revenue) and case acceptance %.
“It’s a numbers game.”
Theme 2: Patients Second
Patient care and the general patient experience was considered at times, but it was a distant second to profit.
The metric used to track patient satisfaction was ORSS (cumulative score of multiple online review sites such as Google, Yelp, etc).
“Once we get our numbers up, we can look at making improvements to the patient experience.”
Contextual Field Studies
I spent two weeks observing the day to day operations at two different Aspen Dental locations.
The first week, by request, I spent at a “high performing” office (HPO) and the second week I spent at the struggling local office that I would be starting at after onboarding.
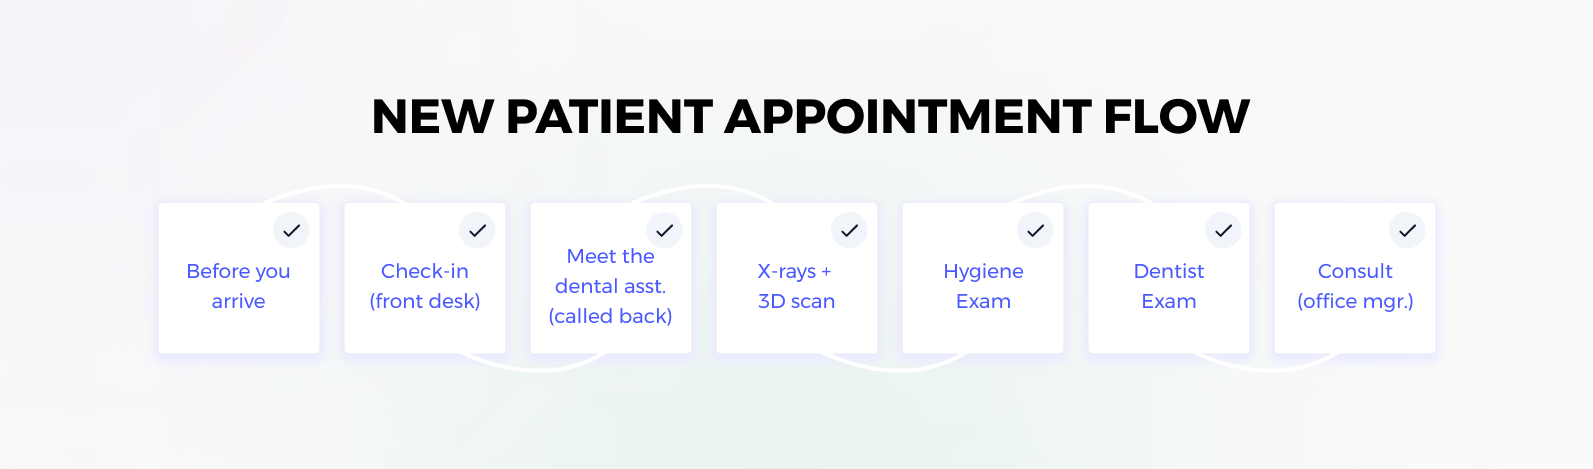
NOTE: BOTH OFFICES FOLLOWED THE SAME “NEW PATIENT FLOW” (AS IT WAS MANDATED BY CORPORATE)
Key insights
Theme 1: Communication
The hygienist and dentist at the HPO took more time with users, communicating and educating throughout the exam process and education patients about treatment recommendations, etc.
Theme 2: Patient care
Patients at the HPO were generally treated more warmly during their visit, whereas the patients at the LPO where generally rushed through the flow and treated like “a number”.
Theme 3: Atmosphere
The overall atmosphere at the HPO was laid back and relaxed, whereas the atmosphere of the LPO seemed tense and rushed. This seemed to negatively affect staff and patients alike.
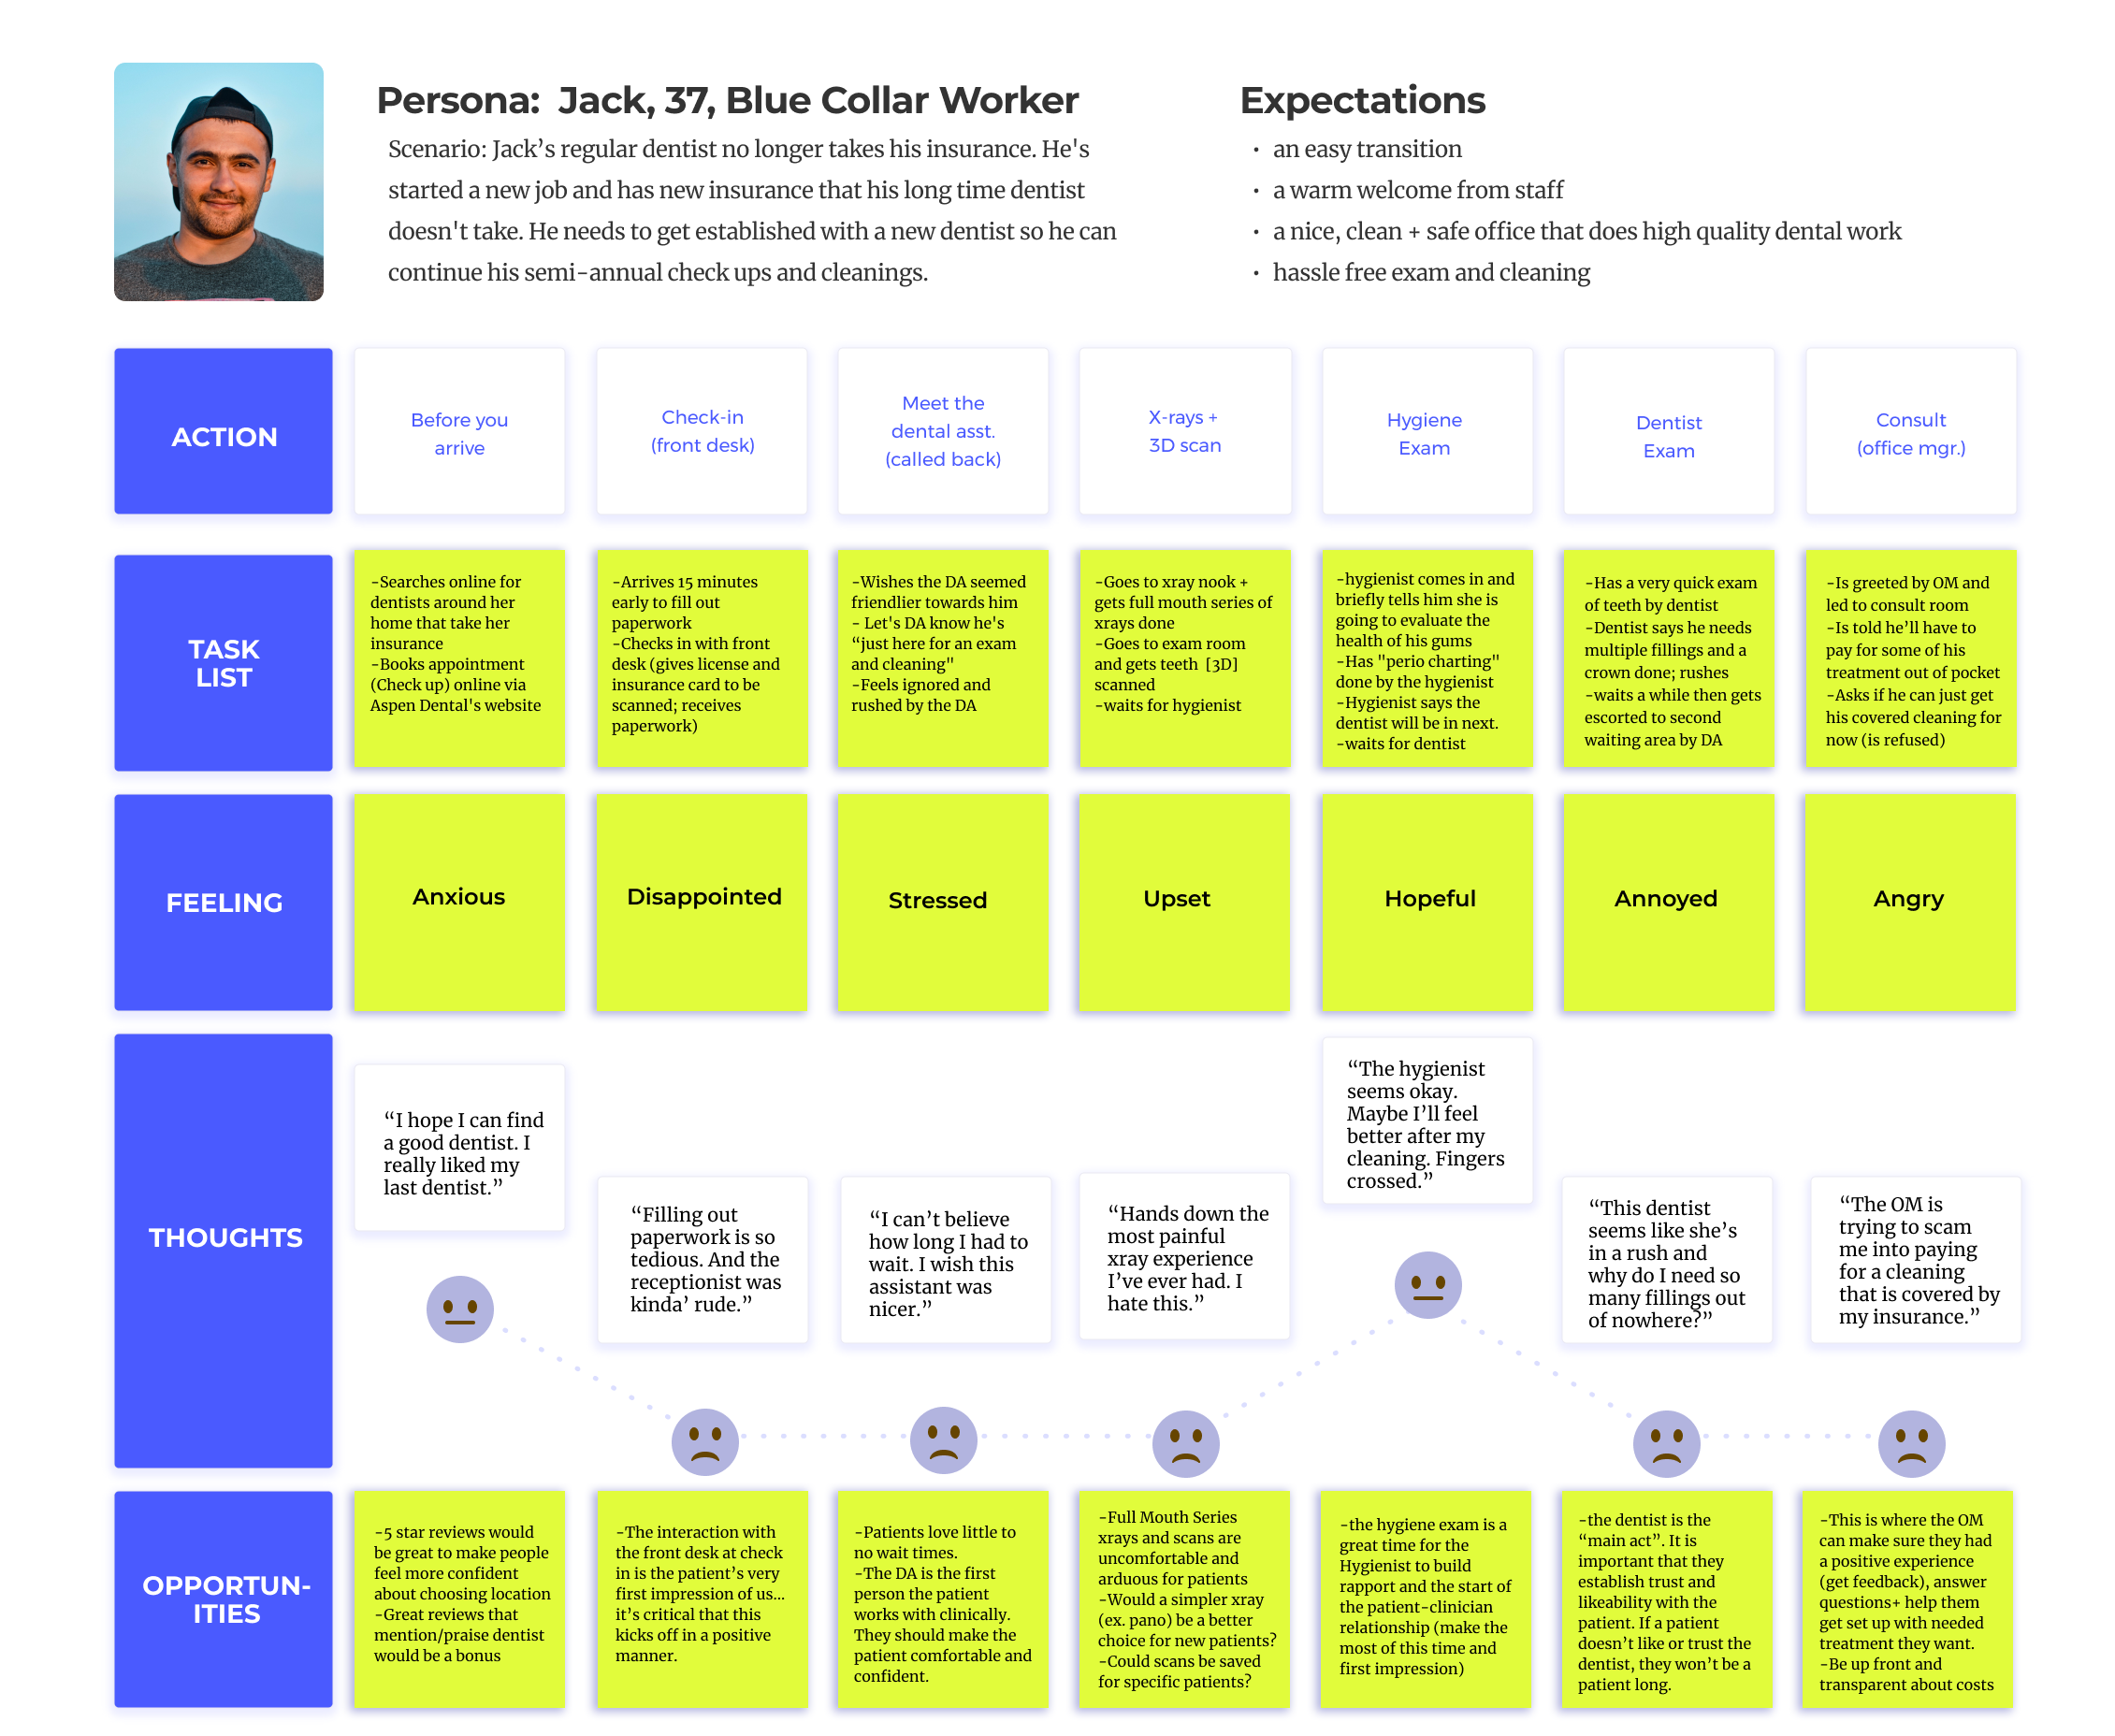
User Journey #1 (based on HPO)
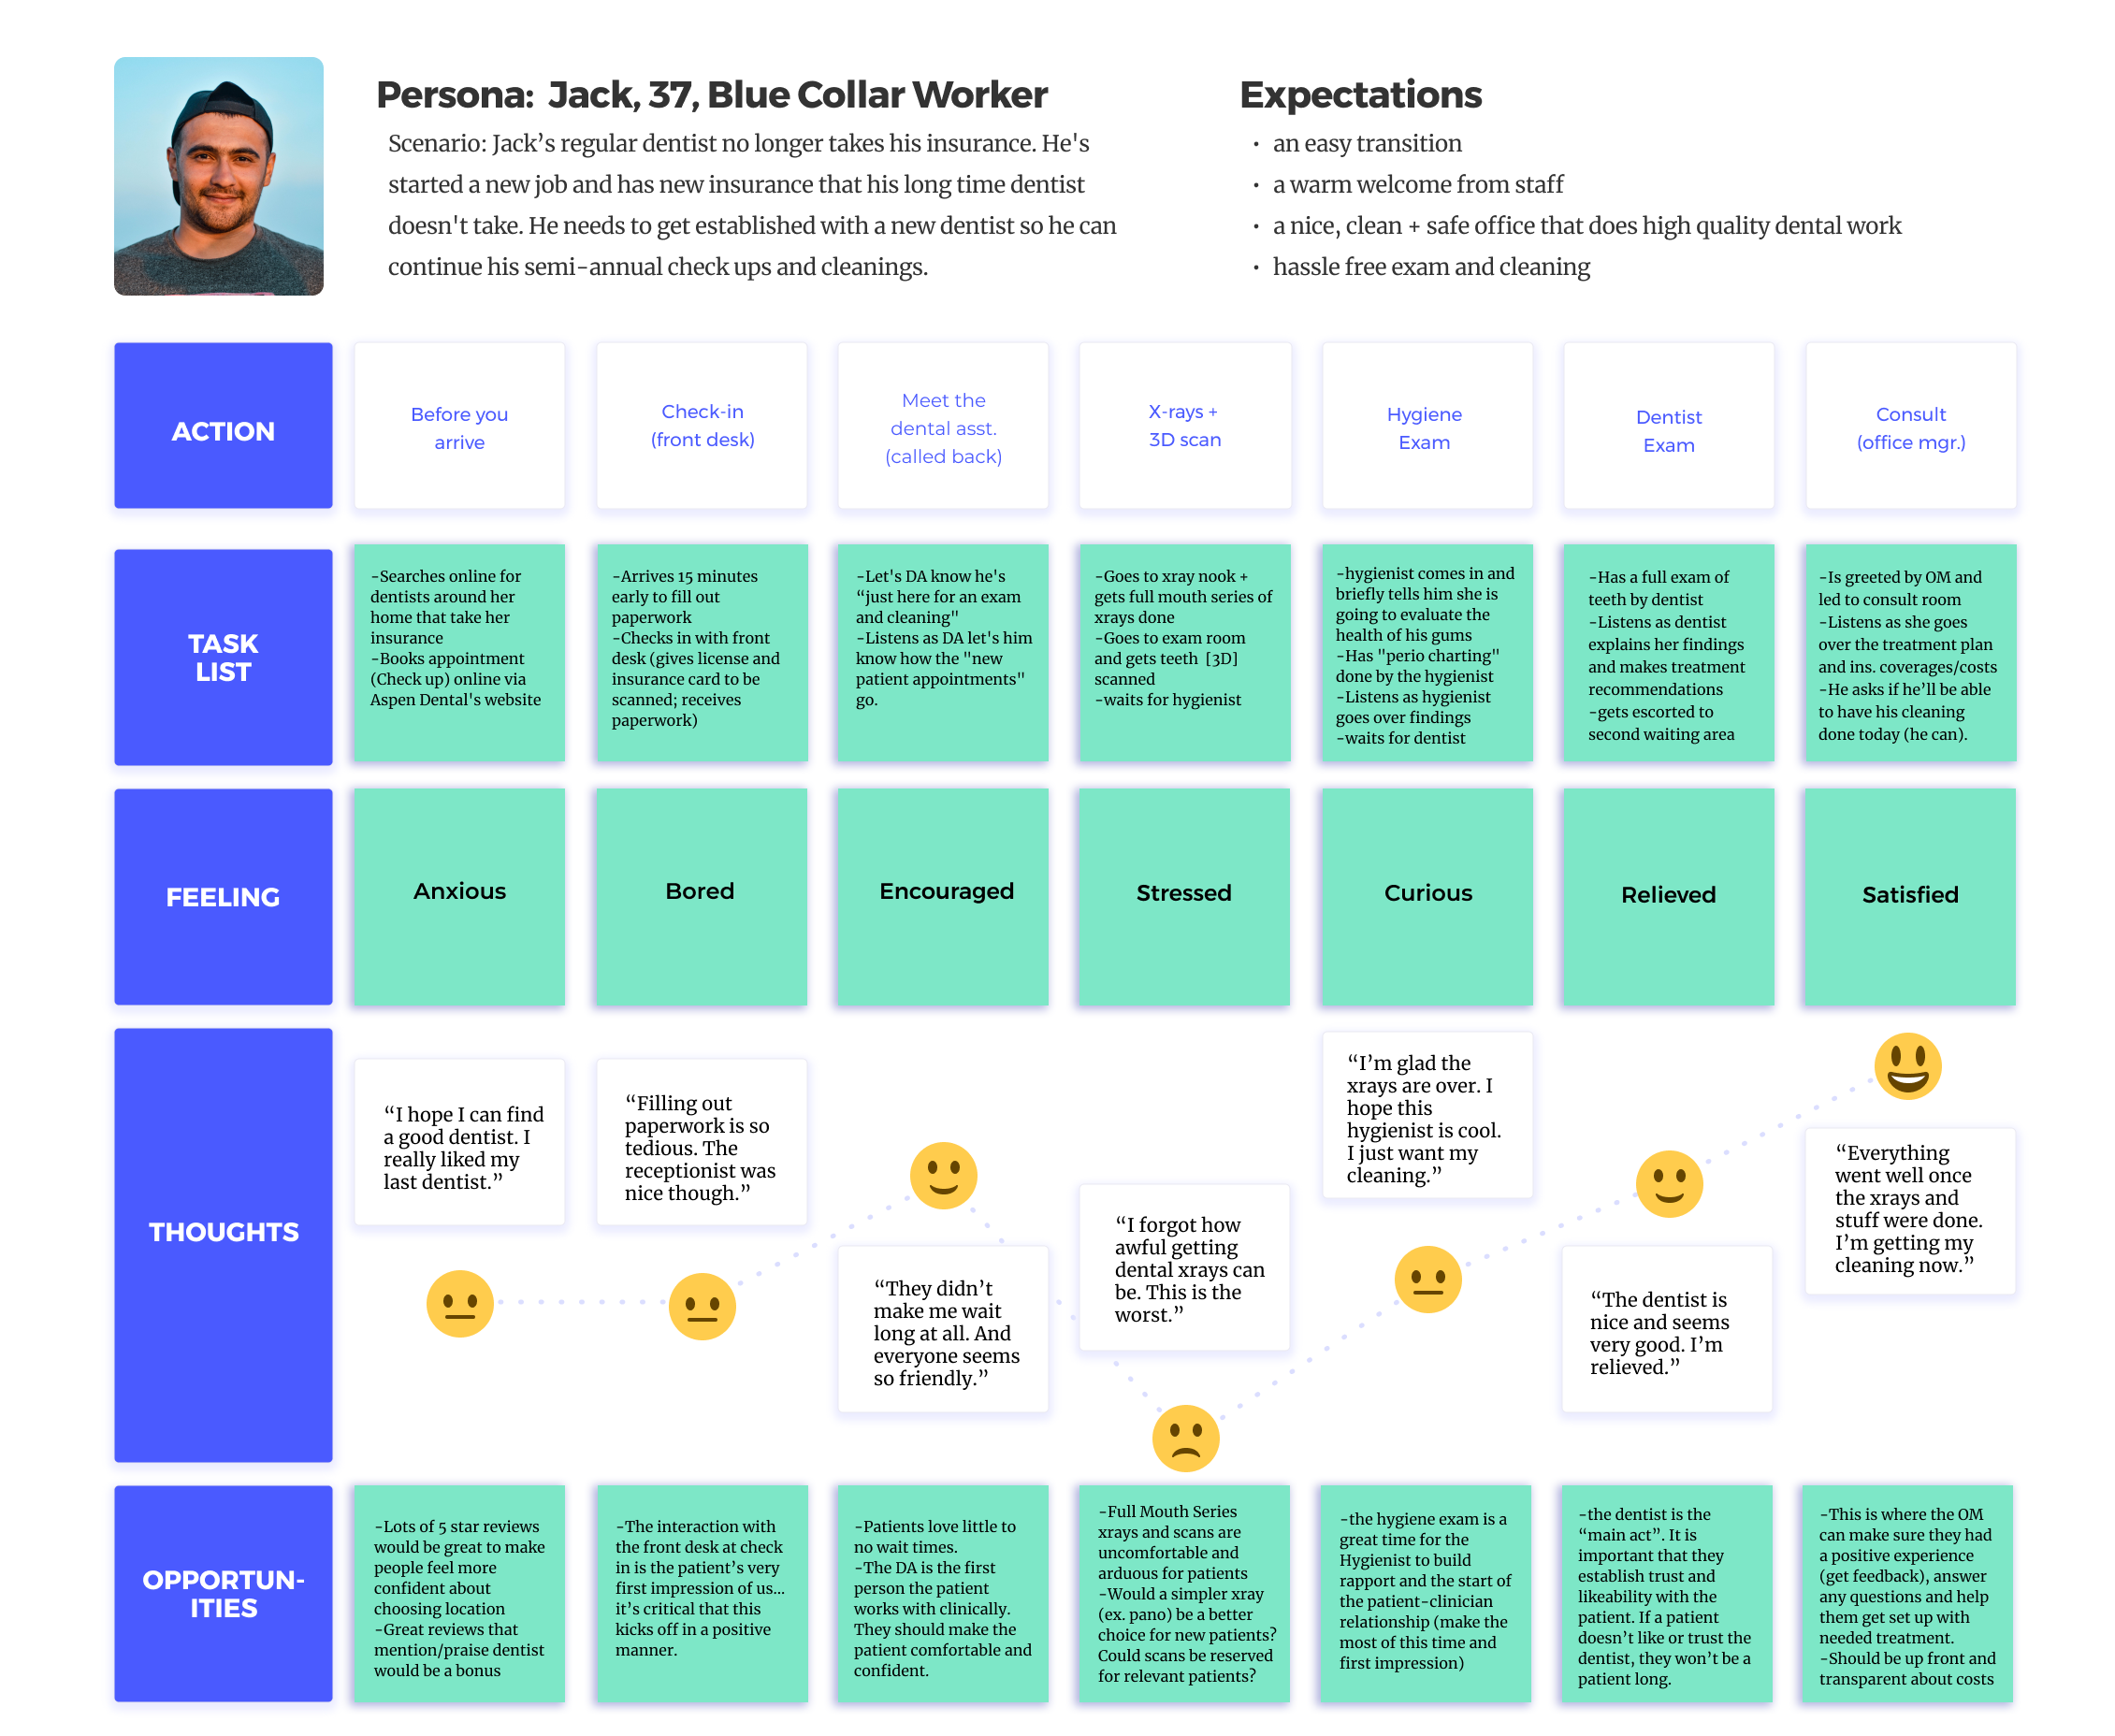
NOTE: AFTER OBSERVING THE SECOND OFFICE, I DECIDED TO DO A SECOND JOURNEY MAP ILLUSTRATING THE CLEAR DIFFERENCES AND DEVIATIONS BETWEEN OFFICES (DESPITE BOTH OFFICES HAVING IDENTICAL PATIENT FLOWS).User Journey #2 (based on LPO)
Patient “happiness” comparisons between offices
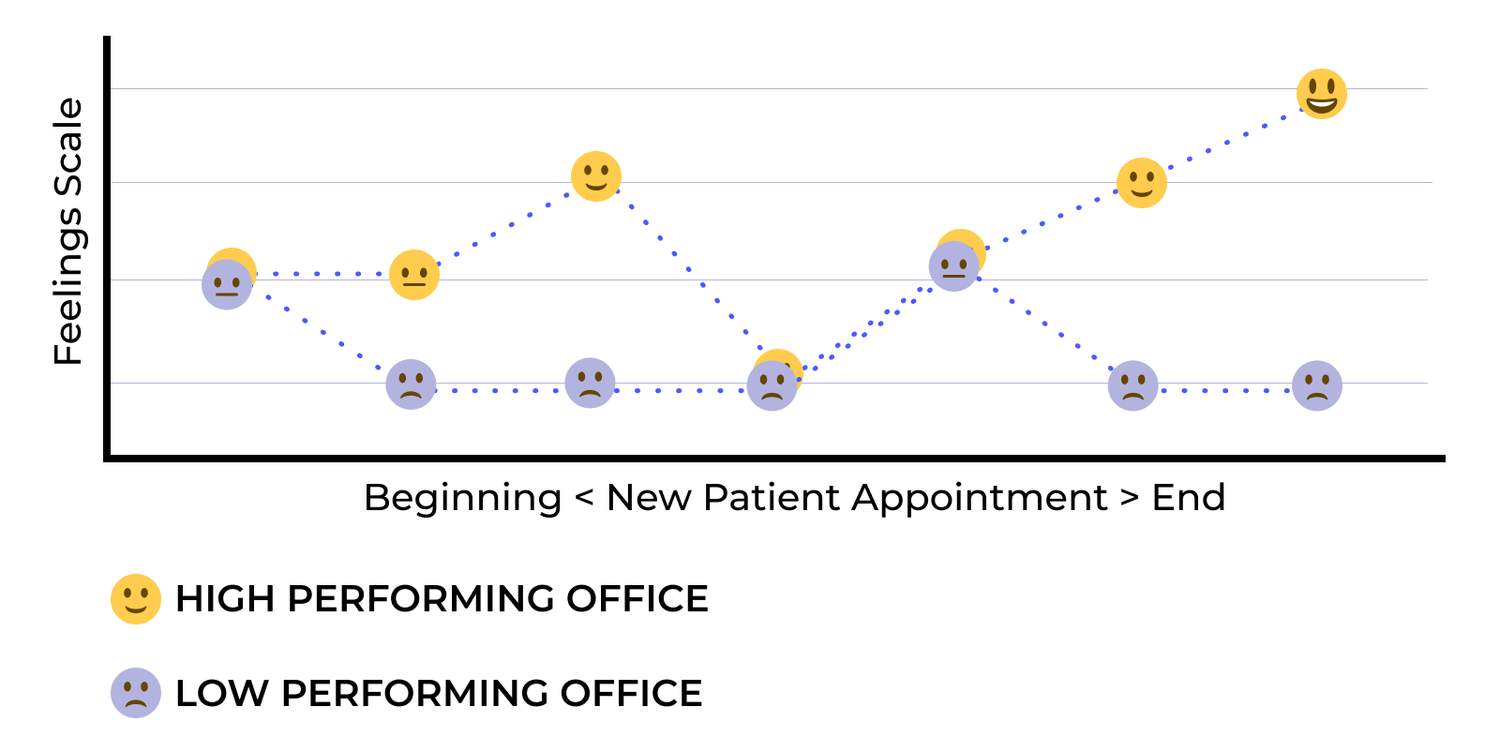
NOTE: INSIGHTS FROM THE USER JOURNEY MAPS, WHILE ANECDOTAL, SUGGEST A CORRELATION BETWEEN PATIENT EXPERIENCE AND OFFICE PERFORMANCE.Patient Review Audit
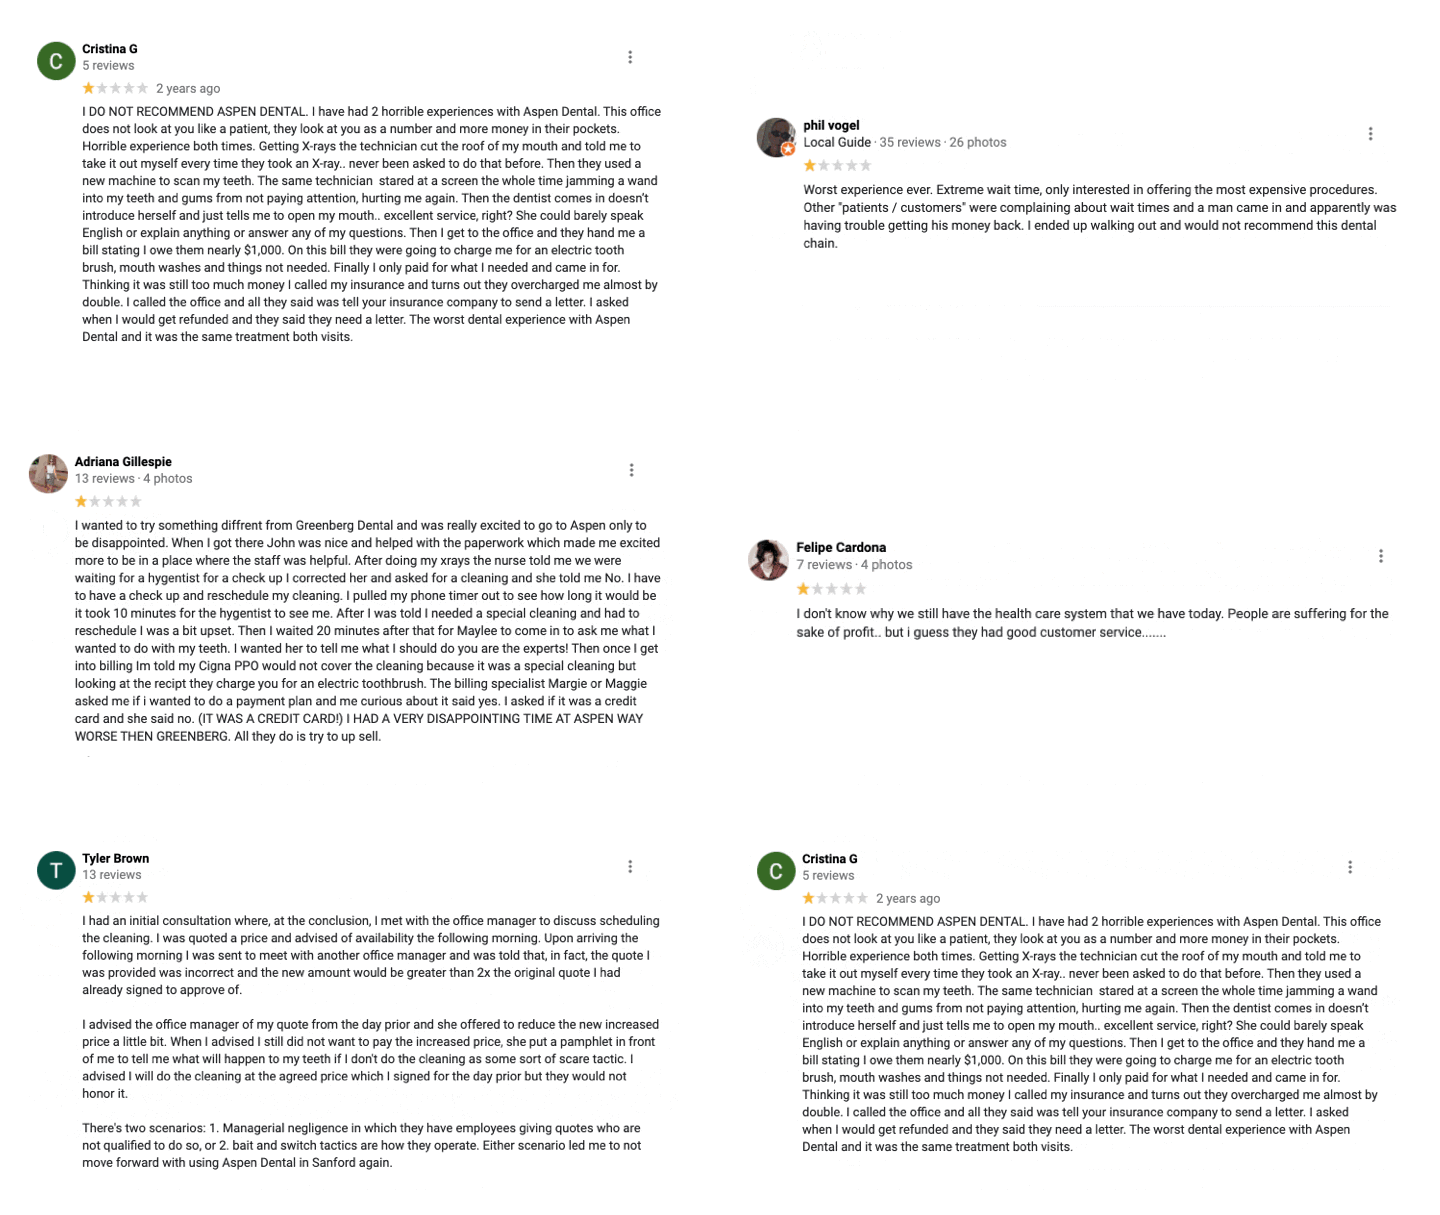
What did the patients have to say?
To gain more insight on the users’ pain points, I took a sample from the most recent twenty 1-3 star Google reviews from the low performing Aspen location
Affinity Mapping
By synthesizing the data from the reviews, I was able to see where the user’s pain points were concentrated.
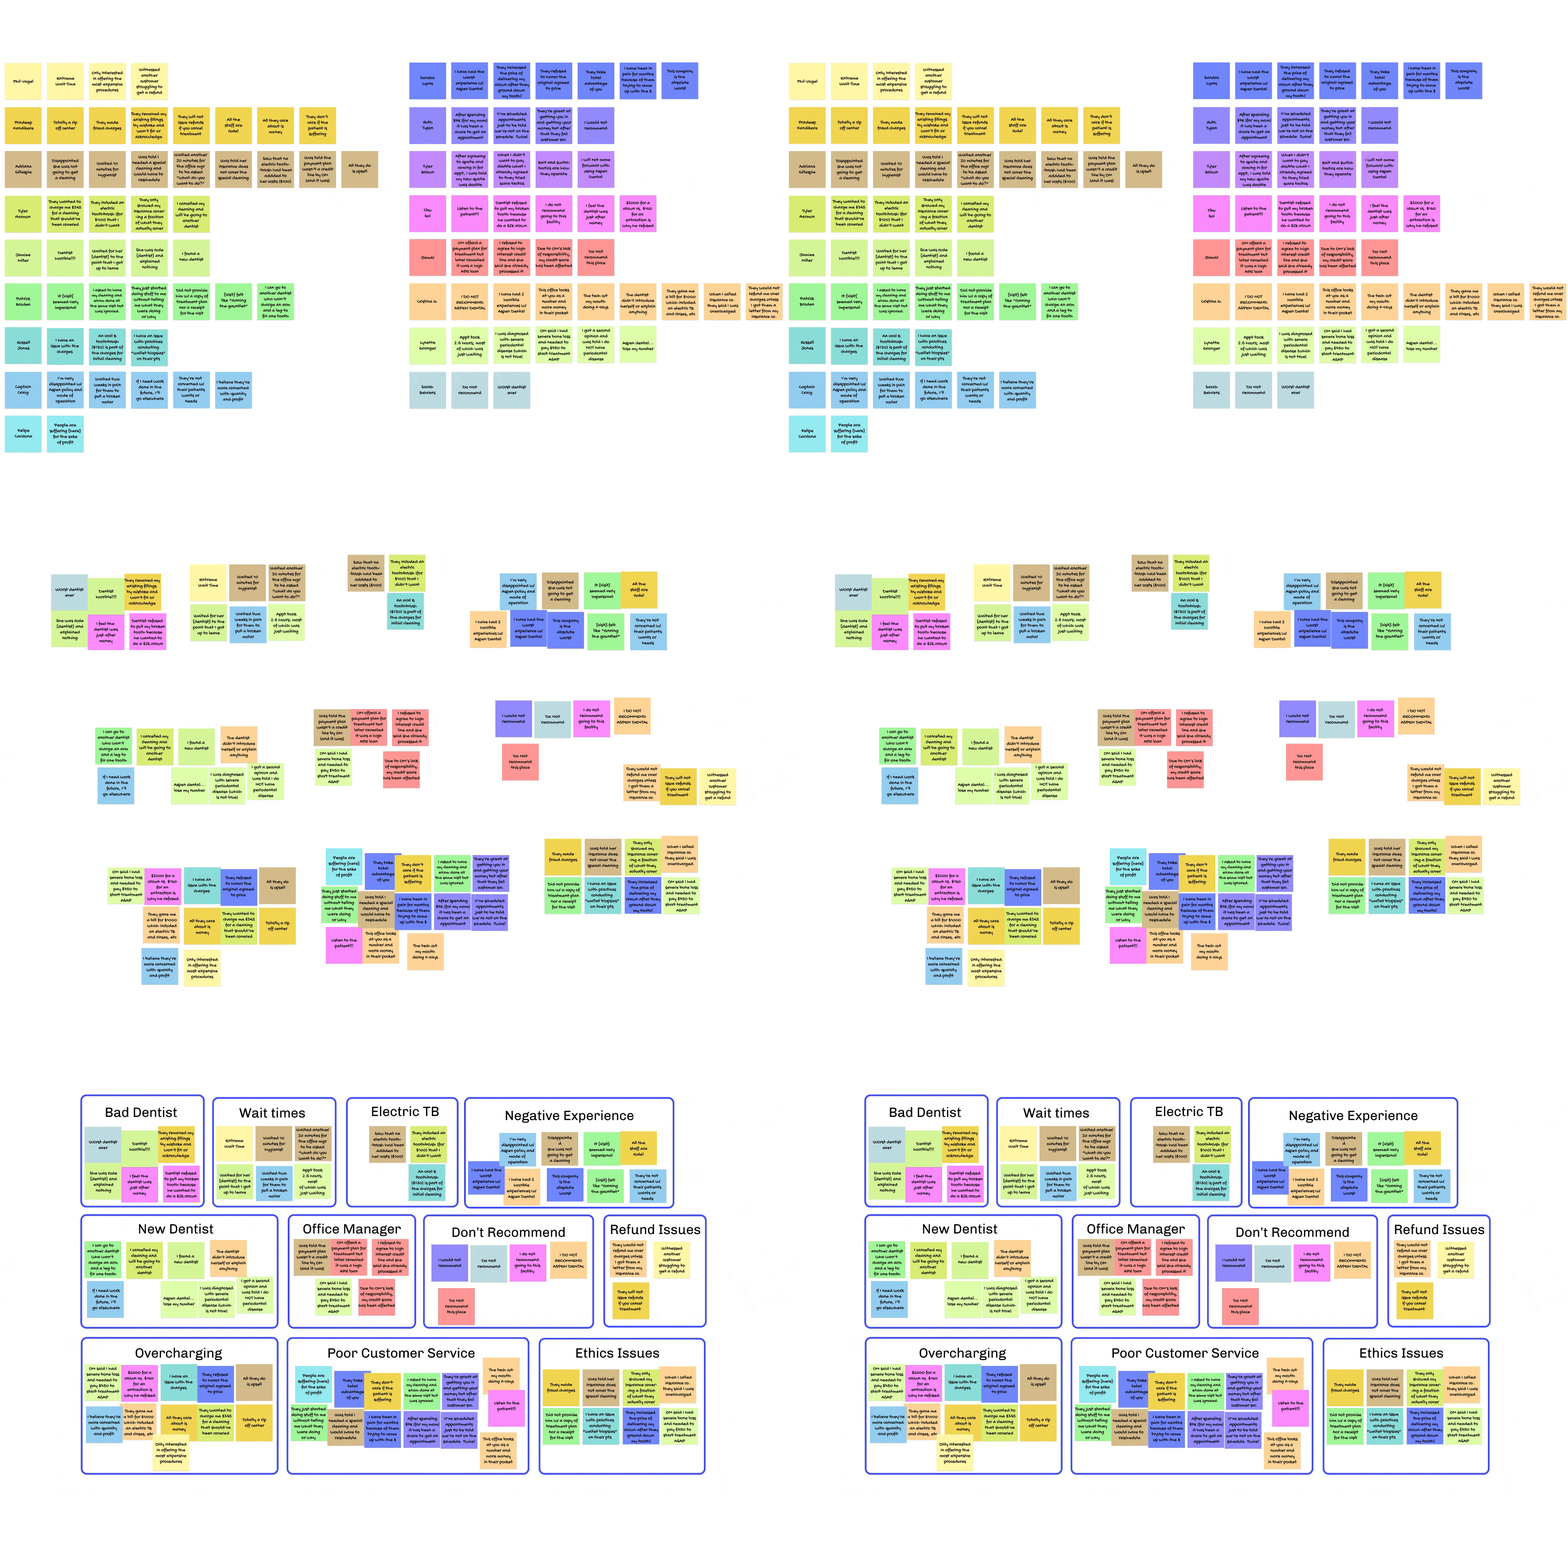
Key insights
Theme 1: Overall disappointing patient care (end to end)
The #1 complaint is poor patient care and/or poor communication.
There are multiple complaints about the dentist as well as wait times/lengths. The most repeated word in reviews is “disappointed”.
Most common course of action taken by unhappy patients is to leave and find a new dentist/dental office.
“Aspen Dental, lose my number.”
Theme 2: “Dark patterns”
Second to poor patient care/communication, patients complain about feeling overcharged, taken advantage of financially and/or “scammed”.
20% of the patients in the sample complained of having an “expensive toothbrush” included in their treatment plan without their consent.
There were also claims of illegal or unethical financial practices.
“People are suffering for the sake of profit.”
The reviews paint a clear picture of what patients DO NOT want.
A jumping off point for the ideation phase was simply to reverse the polarity, and ideate a list of potential solutions.
Based on the current reviews, how might we reverse the polarity?
What would a 5-star experience look like?
Great patient care and communication. This includes staff that take their time with the patient before, during and after each stage of the visit (explaining things, answering questions, educating, etc).
Improved patient wait times and overall in-office experience (reducing the perception of wait times might also be effective). Note: rushing to reduce wait times will likely make things worse.

Be honest, ethical and transparent with all billing and treatment planning practices. Only receive (and thus be charged for) treatments/products they need, want and agree to knowingly.
New patients very much want and expect to have their cleanings on the same day their new patient exam vs. scheduling a second appointment. This should become standard practice if possible.
NOTE: NOTHING GROUND-BREAKING HERE, BUT IT DOES EMPHASIZE THE IMPORTANCE OF GETTING THE FUNDAMENTALS RIGHT.Research Recap
Overwhelmed with insights, I needed to consolidate my findings in order to best inform the next phase of design and narrowing down the most promising solution(s) to focus on.
Stakeholder interviews:
Business wants/needs to increase office revenue (correlated with increasing new patient case acceptance % metric).
Contextual field studies:
Anecdotally, the better both patients and staff are treated, the better the office seemed to perform.
User journey maps:
Highlighted points of opportunity for improving the new patient flow, most notably the latter part of the appointment (hygiene exam, dentist exam and consult).
User reviews:
Patient communication and customer care (with an emphasis on honesty, high ethics and transparency) would be an impactful place to start making positive changes.
NOTE: NOTHING GROUND-BREAKING HERE, BUT IT DOES EMPHASIZE THE IMPORTANCE OF GETTING THE FUNDAMENTALS RIGHT.The elephant in the room (constraints + pushback)
I had signficant constraints that needed to be acknowledged before I moved forward with the ideation phase.
I did not have buy in nor much cooperation with the office dentist or manager. They believed the solution was to do more of what they were already doing, increasing revenue via “the numbers game”.
This meant, unless I aligned with their approach for testing (which ran counter with what the users wanted) I would be extremely limited as to where it was realistic for me to attempt to affect change.
Specifically, it left me with the hygienist (who luckily, was open to trying new things to improve things at the office).

FULL DISCLOSURE: THE HYGIENIST (LIKE THE DENTIST) BONUS MONTHLY (OR NOT) BASED ON OFFICE REVENUE. SO THE HYGIENIST WOULD LIKELY DOUBLE DOWN WHERE HE THOUGHT IT WOULD BE MOST BENEFICIAL.How might we…
…increase office revenue whilst improving the user/patient experience (given our constraints and data)?
Using IDEO’s “Desirability, Feasibility, Viability” Process, it turned out to be rather easy to deduce what the ripest areas of opportunity were.
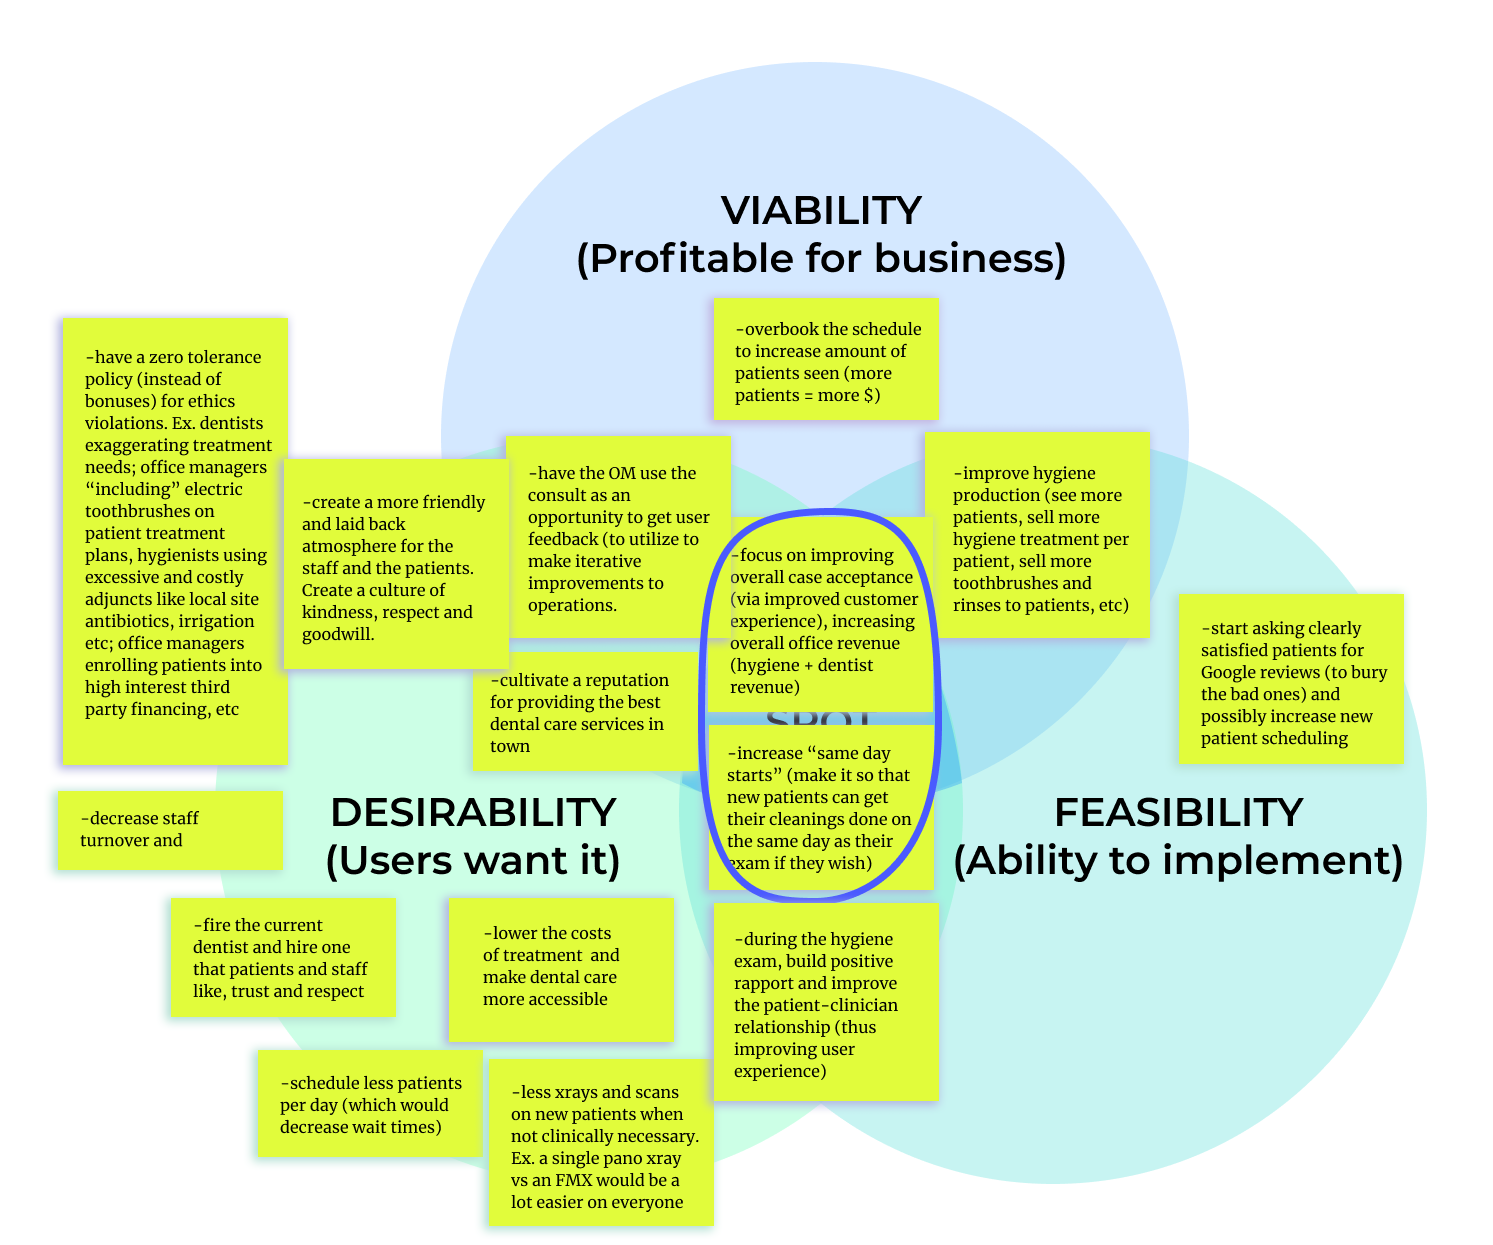
I sat down and did a brainstorming session and listed out all the possibilities for solutions (the mild to the wild, as my mentor says).
After filtering through the IDEO Venn (Desirability, Feasibility and Viability), I had two contenders to move forward with:
Attempting to improve “Case Acceptance %”* via the hygiene exam experience.
Attempting to increase “Same Day Starts”** where the hygienist was able.
*CASE ACCEPTANCE % IS THE PERCENTAGE OF TREATMENT ACCEPTED, SCHEDULED AND COMPLETED BY PATIENTS OUT OF THE TREATMENT PLAN THEY HAVE BEEN RECOMMENDED.
**SAME DAY STARTS, FOR A HYGIENIST, IS HOW MANY NEW PATIENT (EXTRA) CLEANINGS ONE CAN DO IN ADDITION TO THEIR SCHEDULE OF RETURNING PATIENTS.
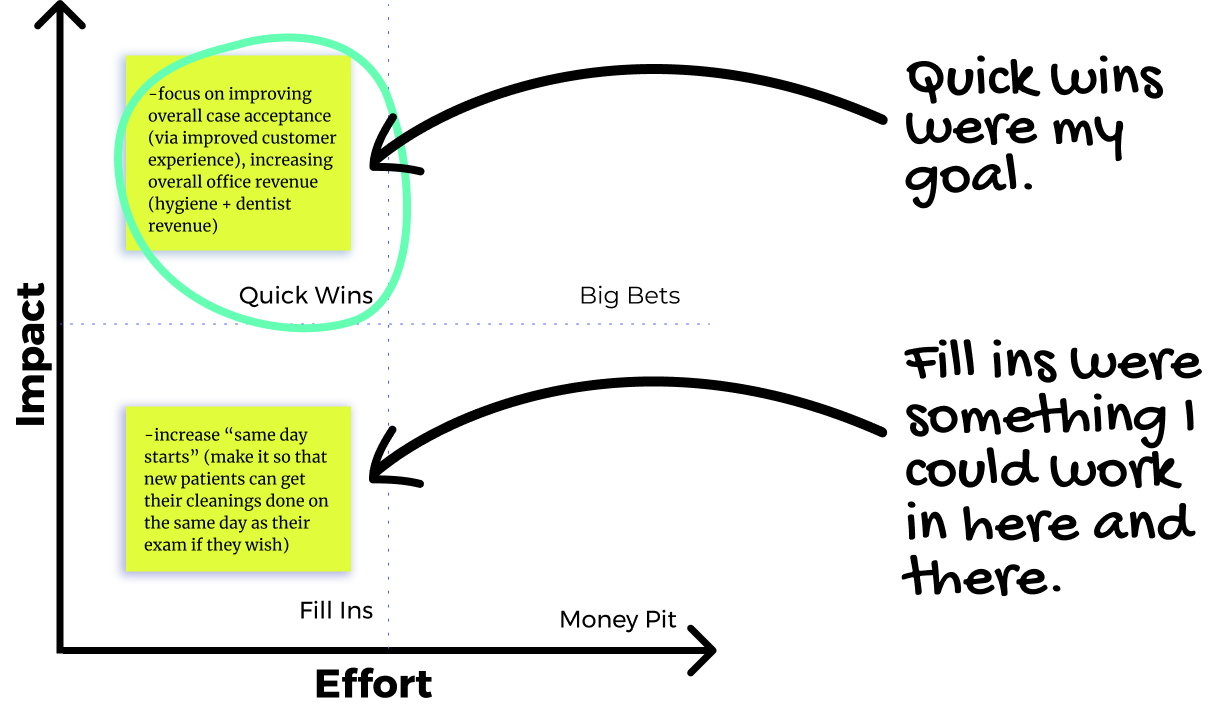
I took my “finalist” opportunity ideas to the Impact-Effort matrix and decided to move forward with “Improve Case Acceptance %” as the focus and metric for success.
Action plan
After meeting with Case Acceptance SME, Jeff Palmer, I was ready to turn my insights and decisions into a game plan.
REMINDER: THE BUSINESS METRIC WE ARE FOCUSED ON TRACKING/IMPROVING IS CASE ACCEPTANCE % AND THE CONSTRAINT I HAVE IS ONLY BEING ABLE TO AFFECT CHANGE DURING THE HYGIENIST'S PORTION OF THE NEW PATIENT FLOW.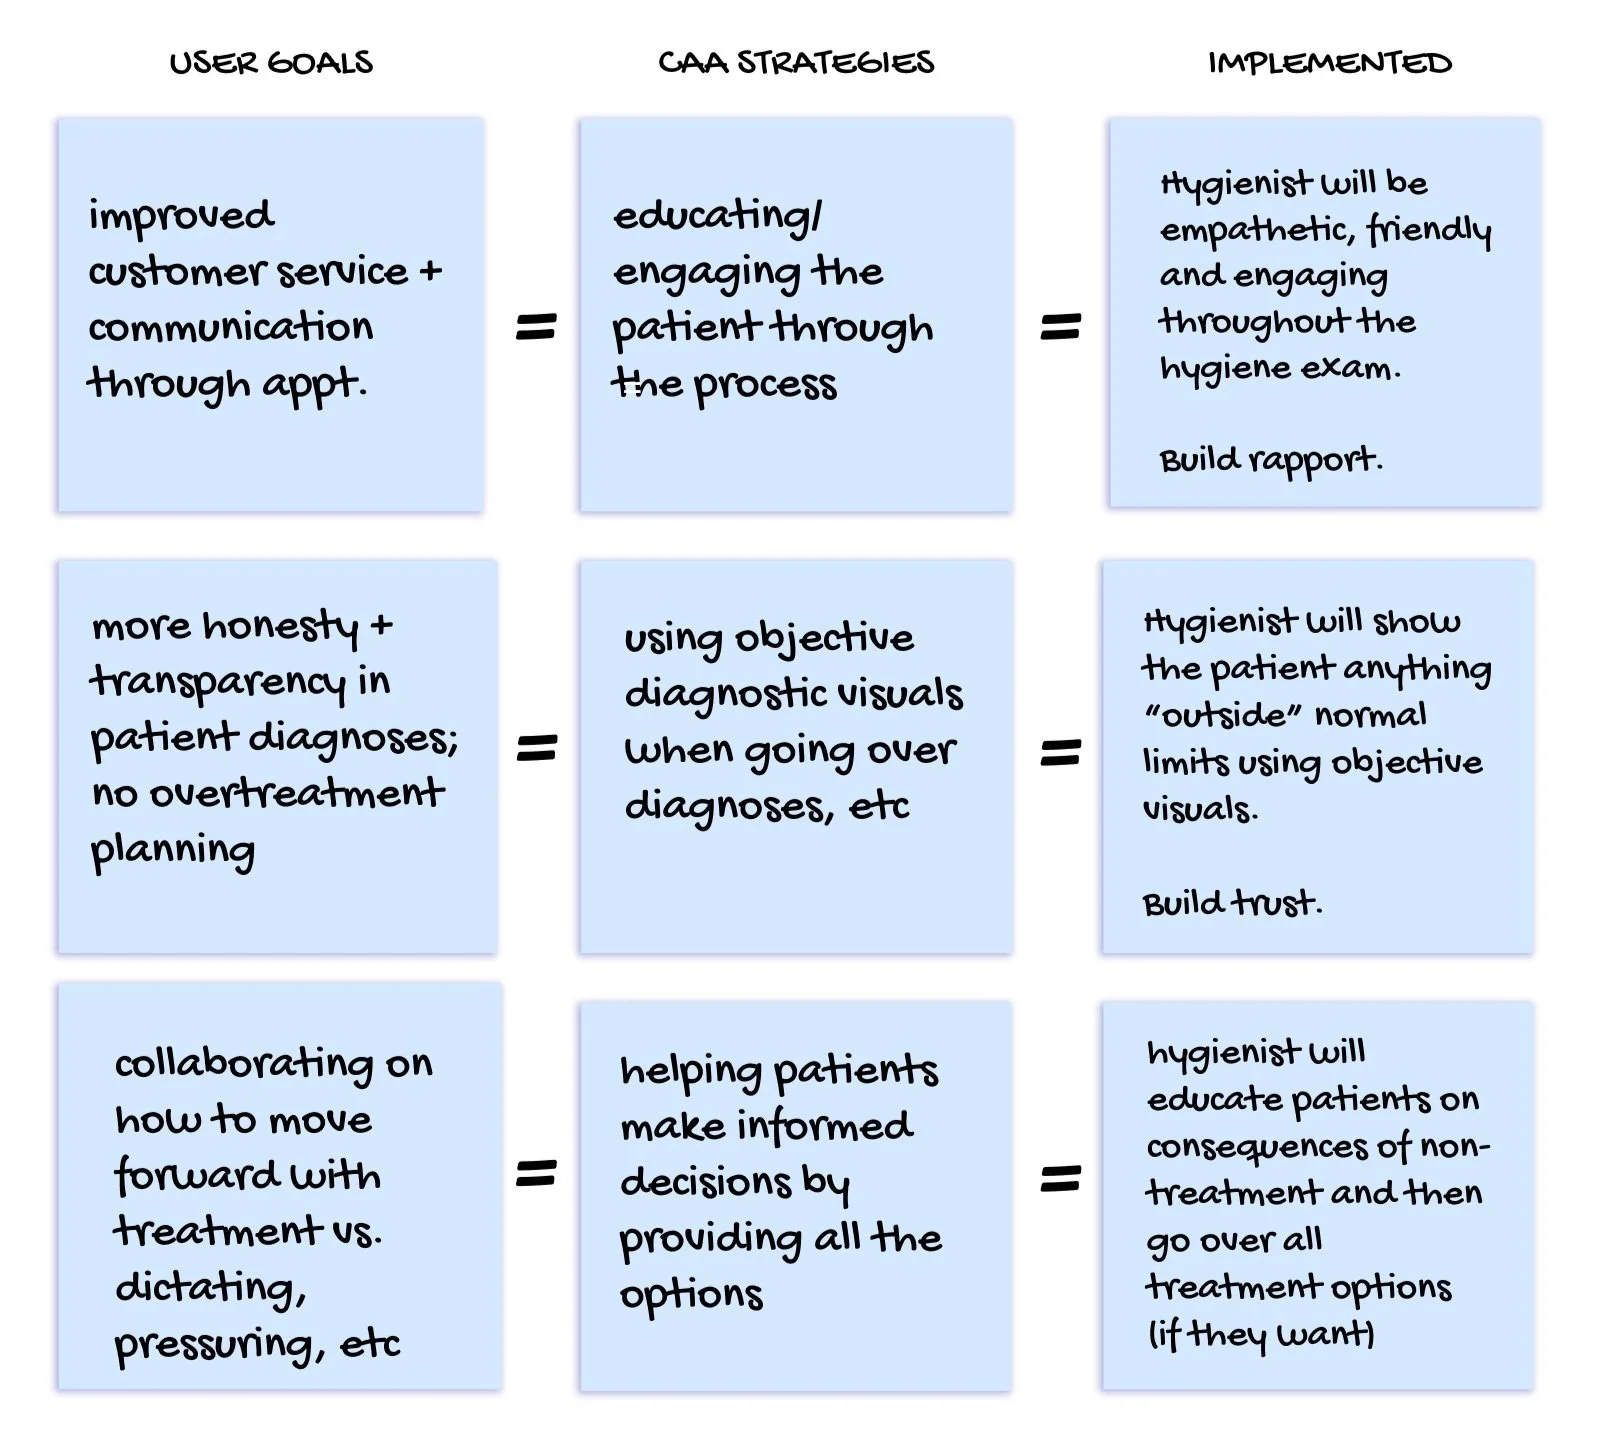
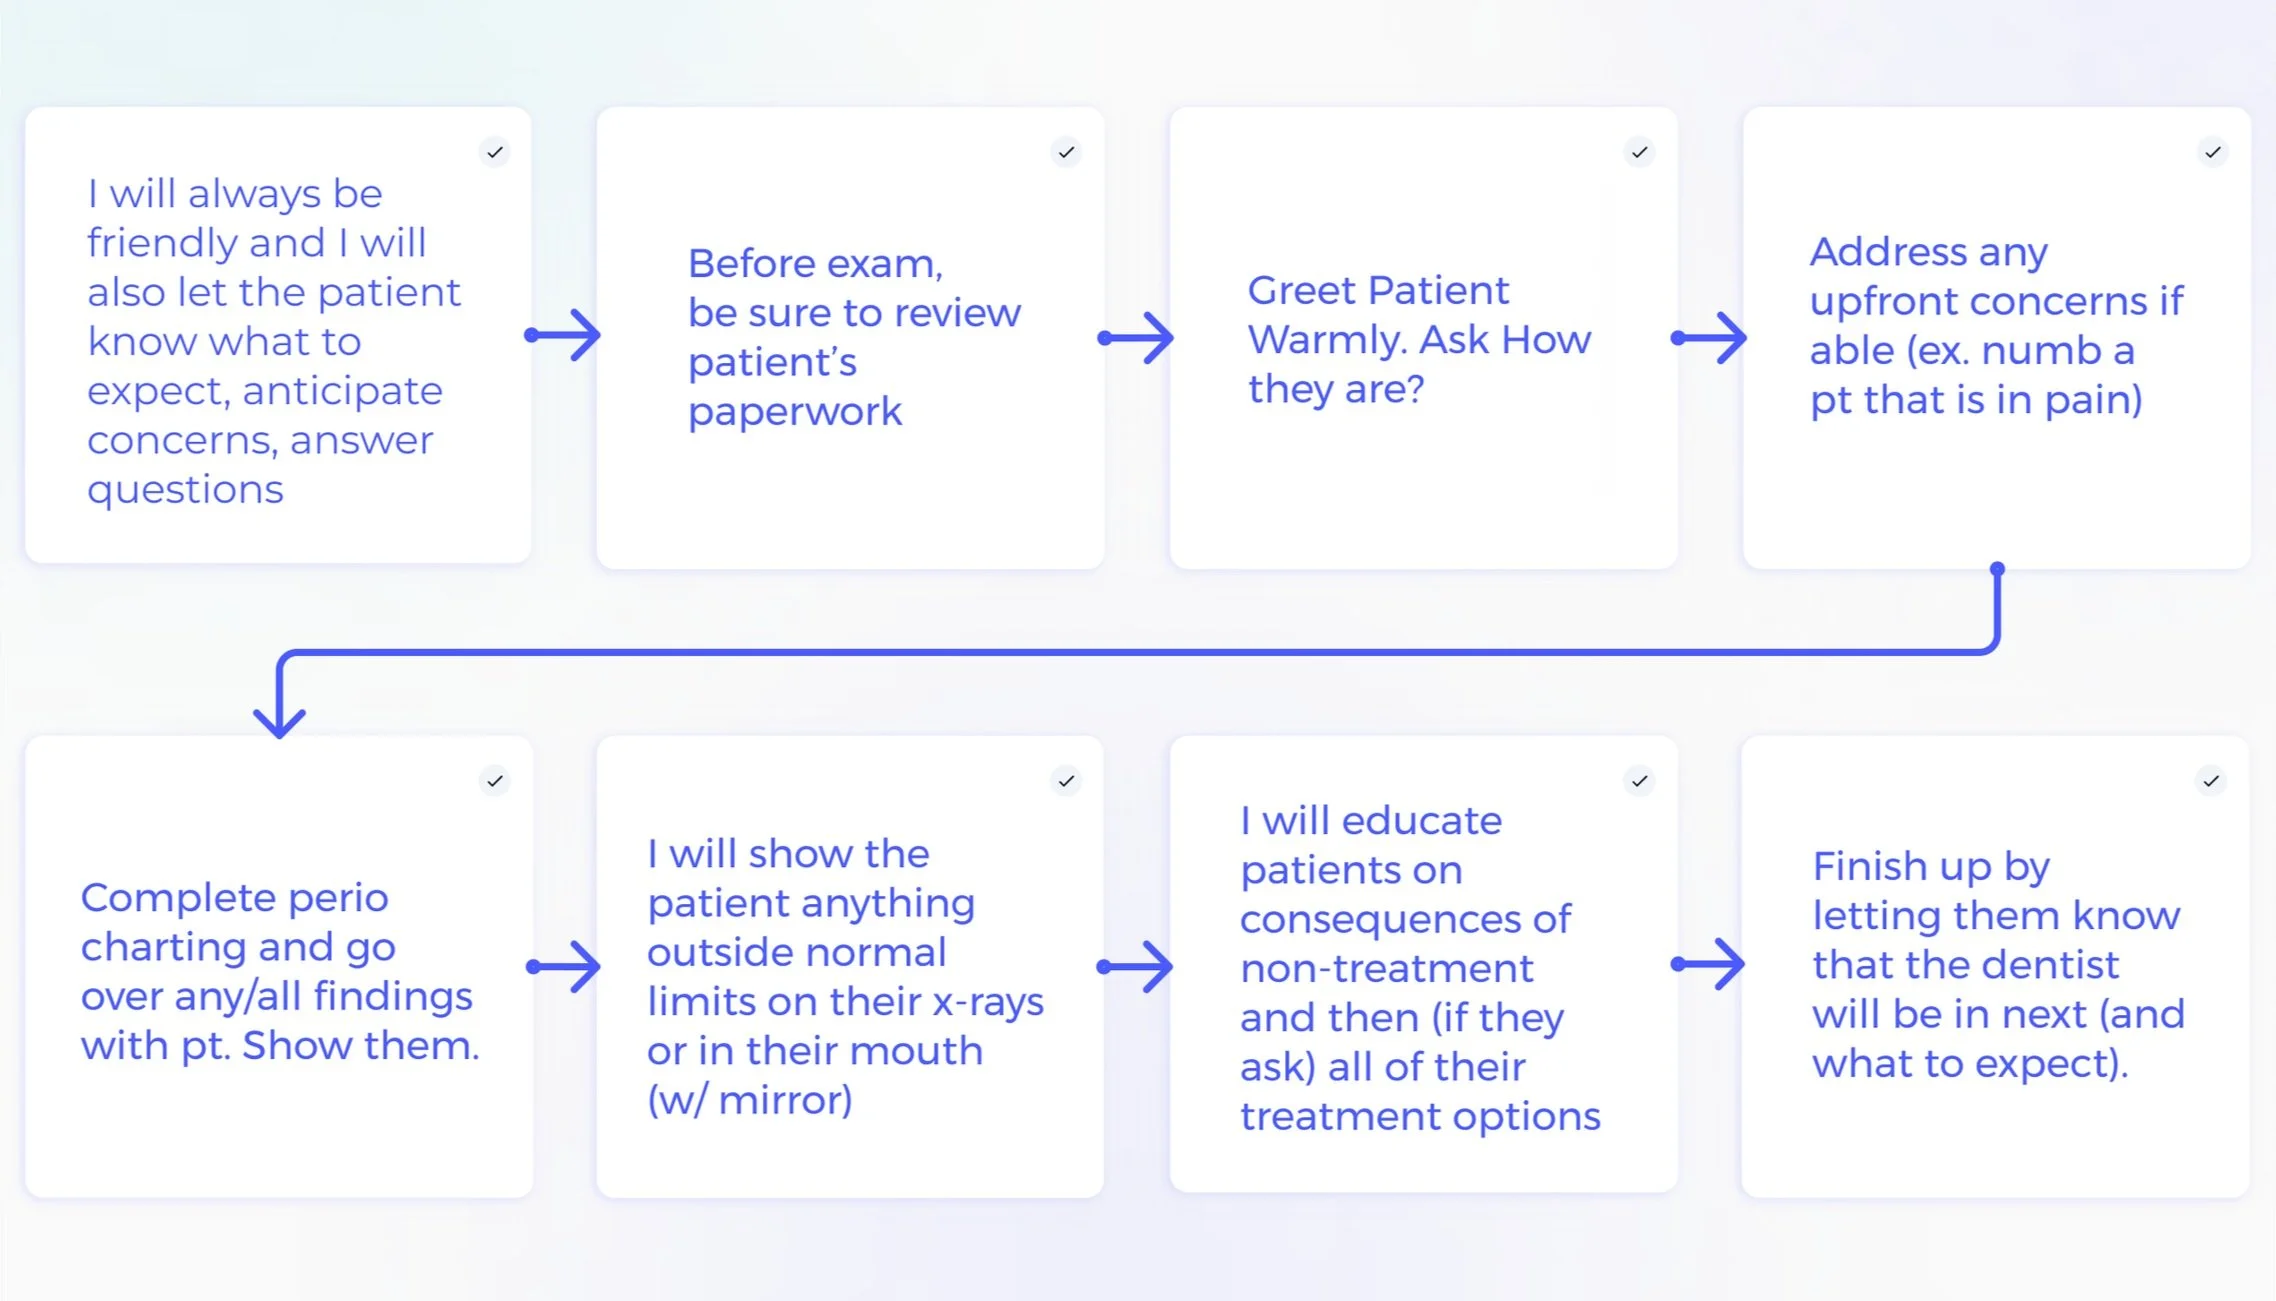
Utilizing these guidelines, we collaborated on a simple end-to-end workflow for the hygienist to take patients through.
User Testing
We decided to test the new workflow and review the metrics both:
Monthly (where we might make micro-changes and pivots) and
Quarterly (where we would make any major iterative changes based on feedback).
Here is the play by play.
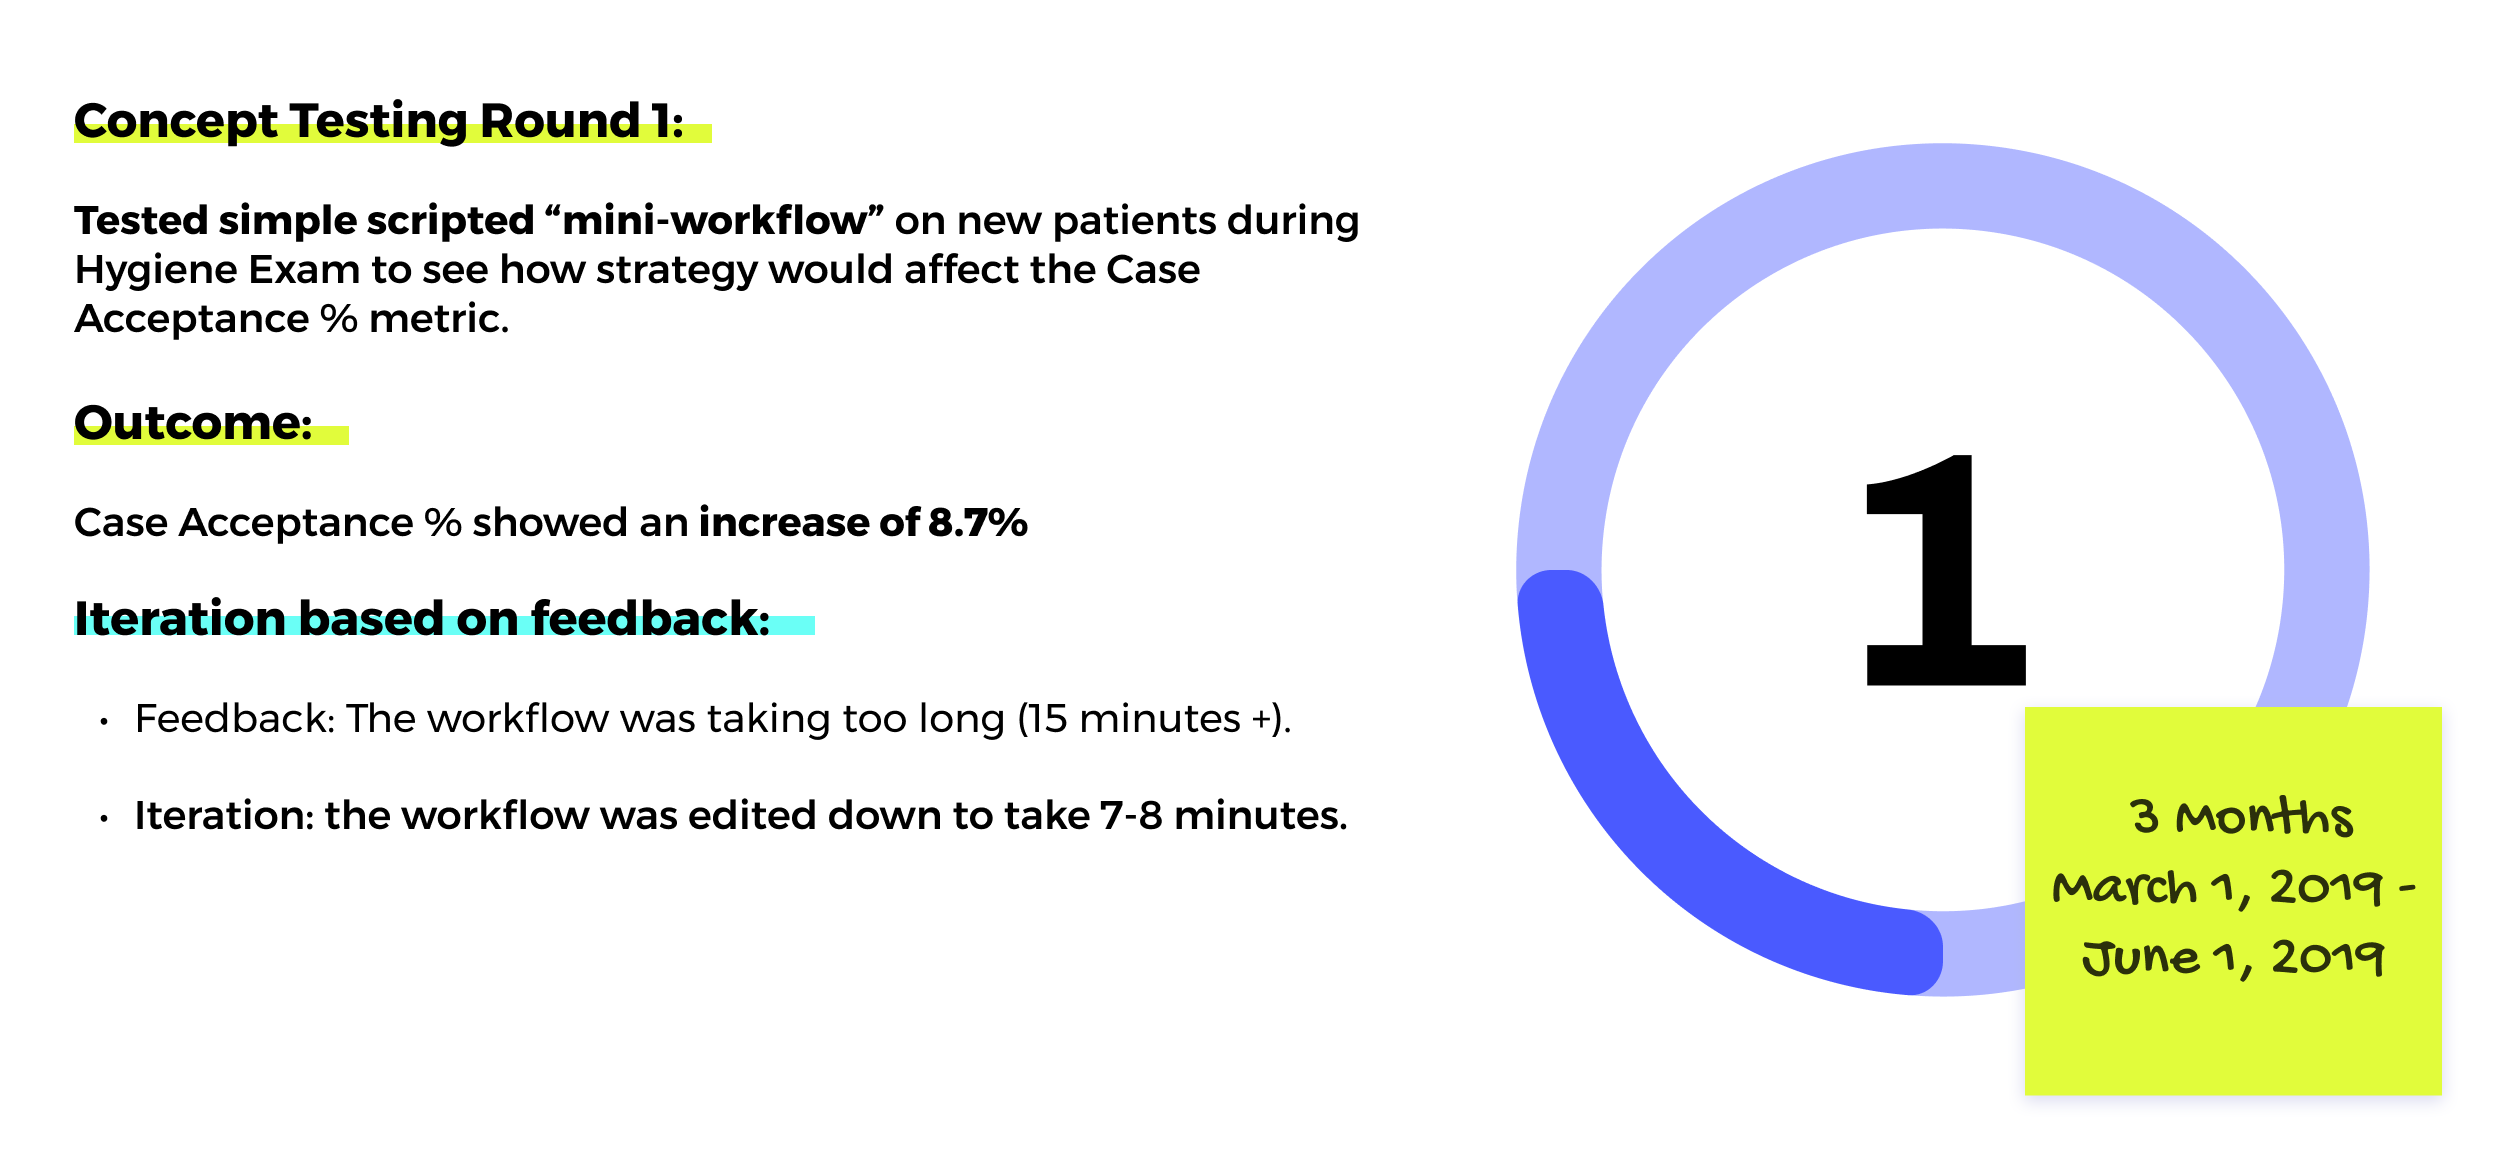
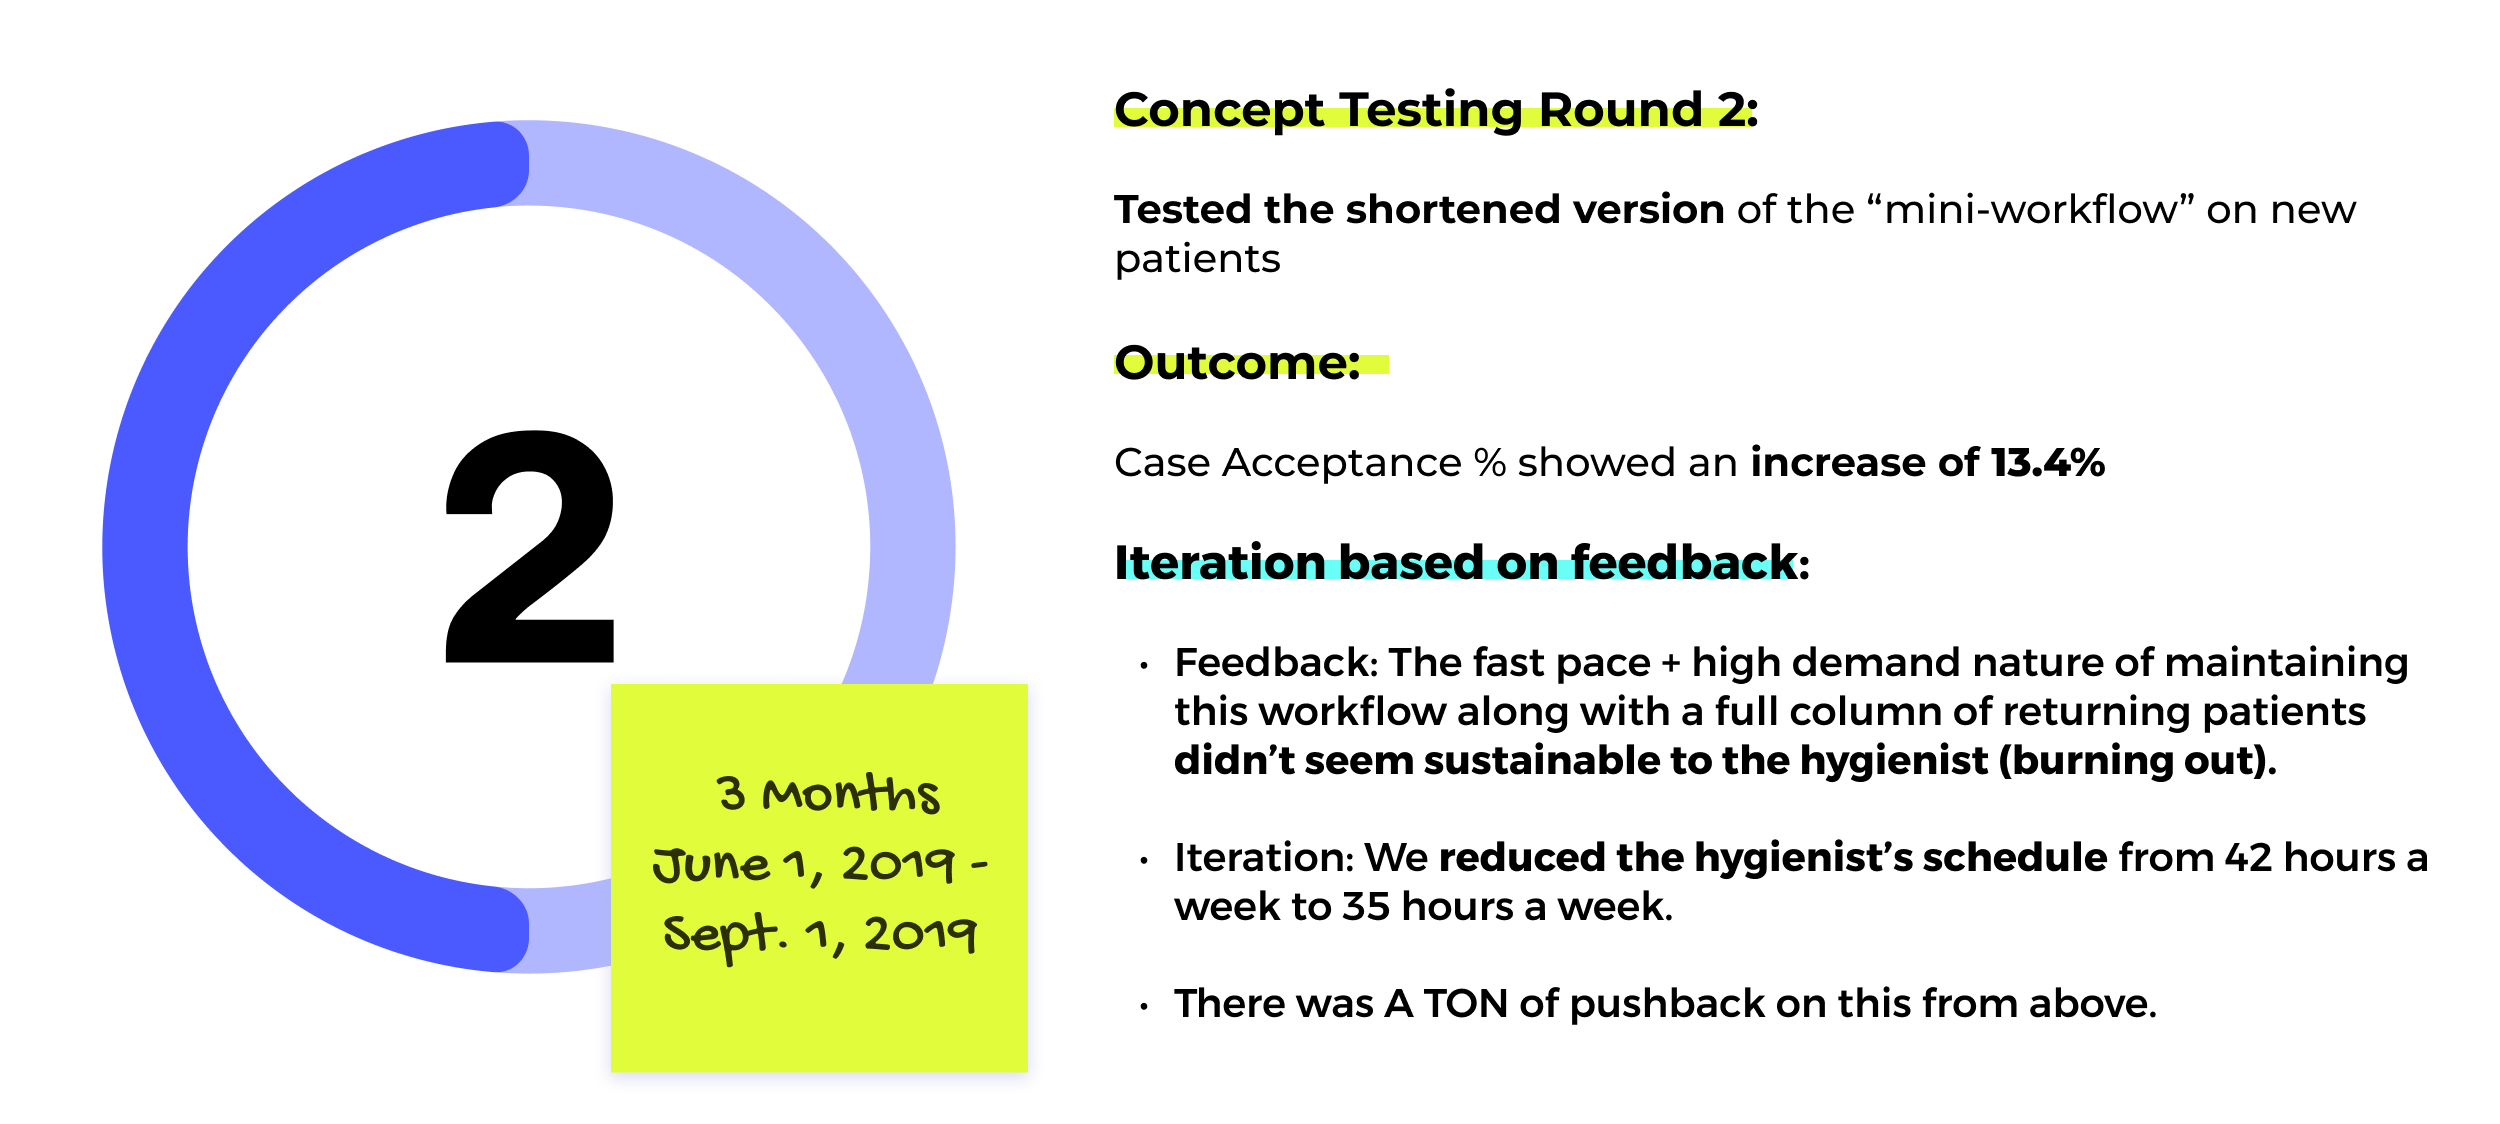
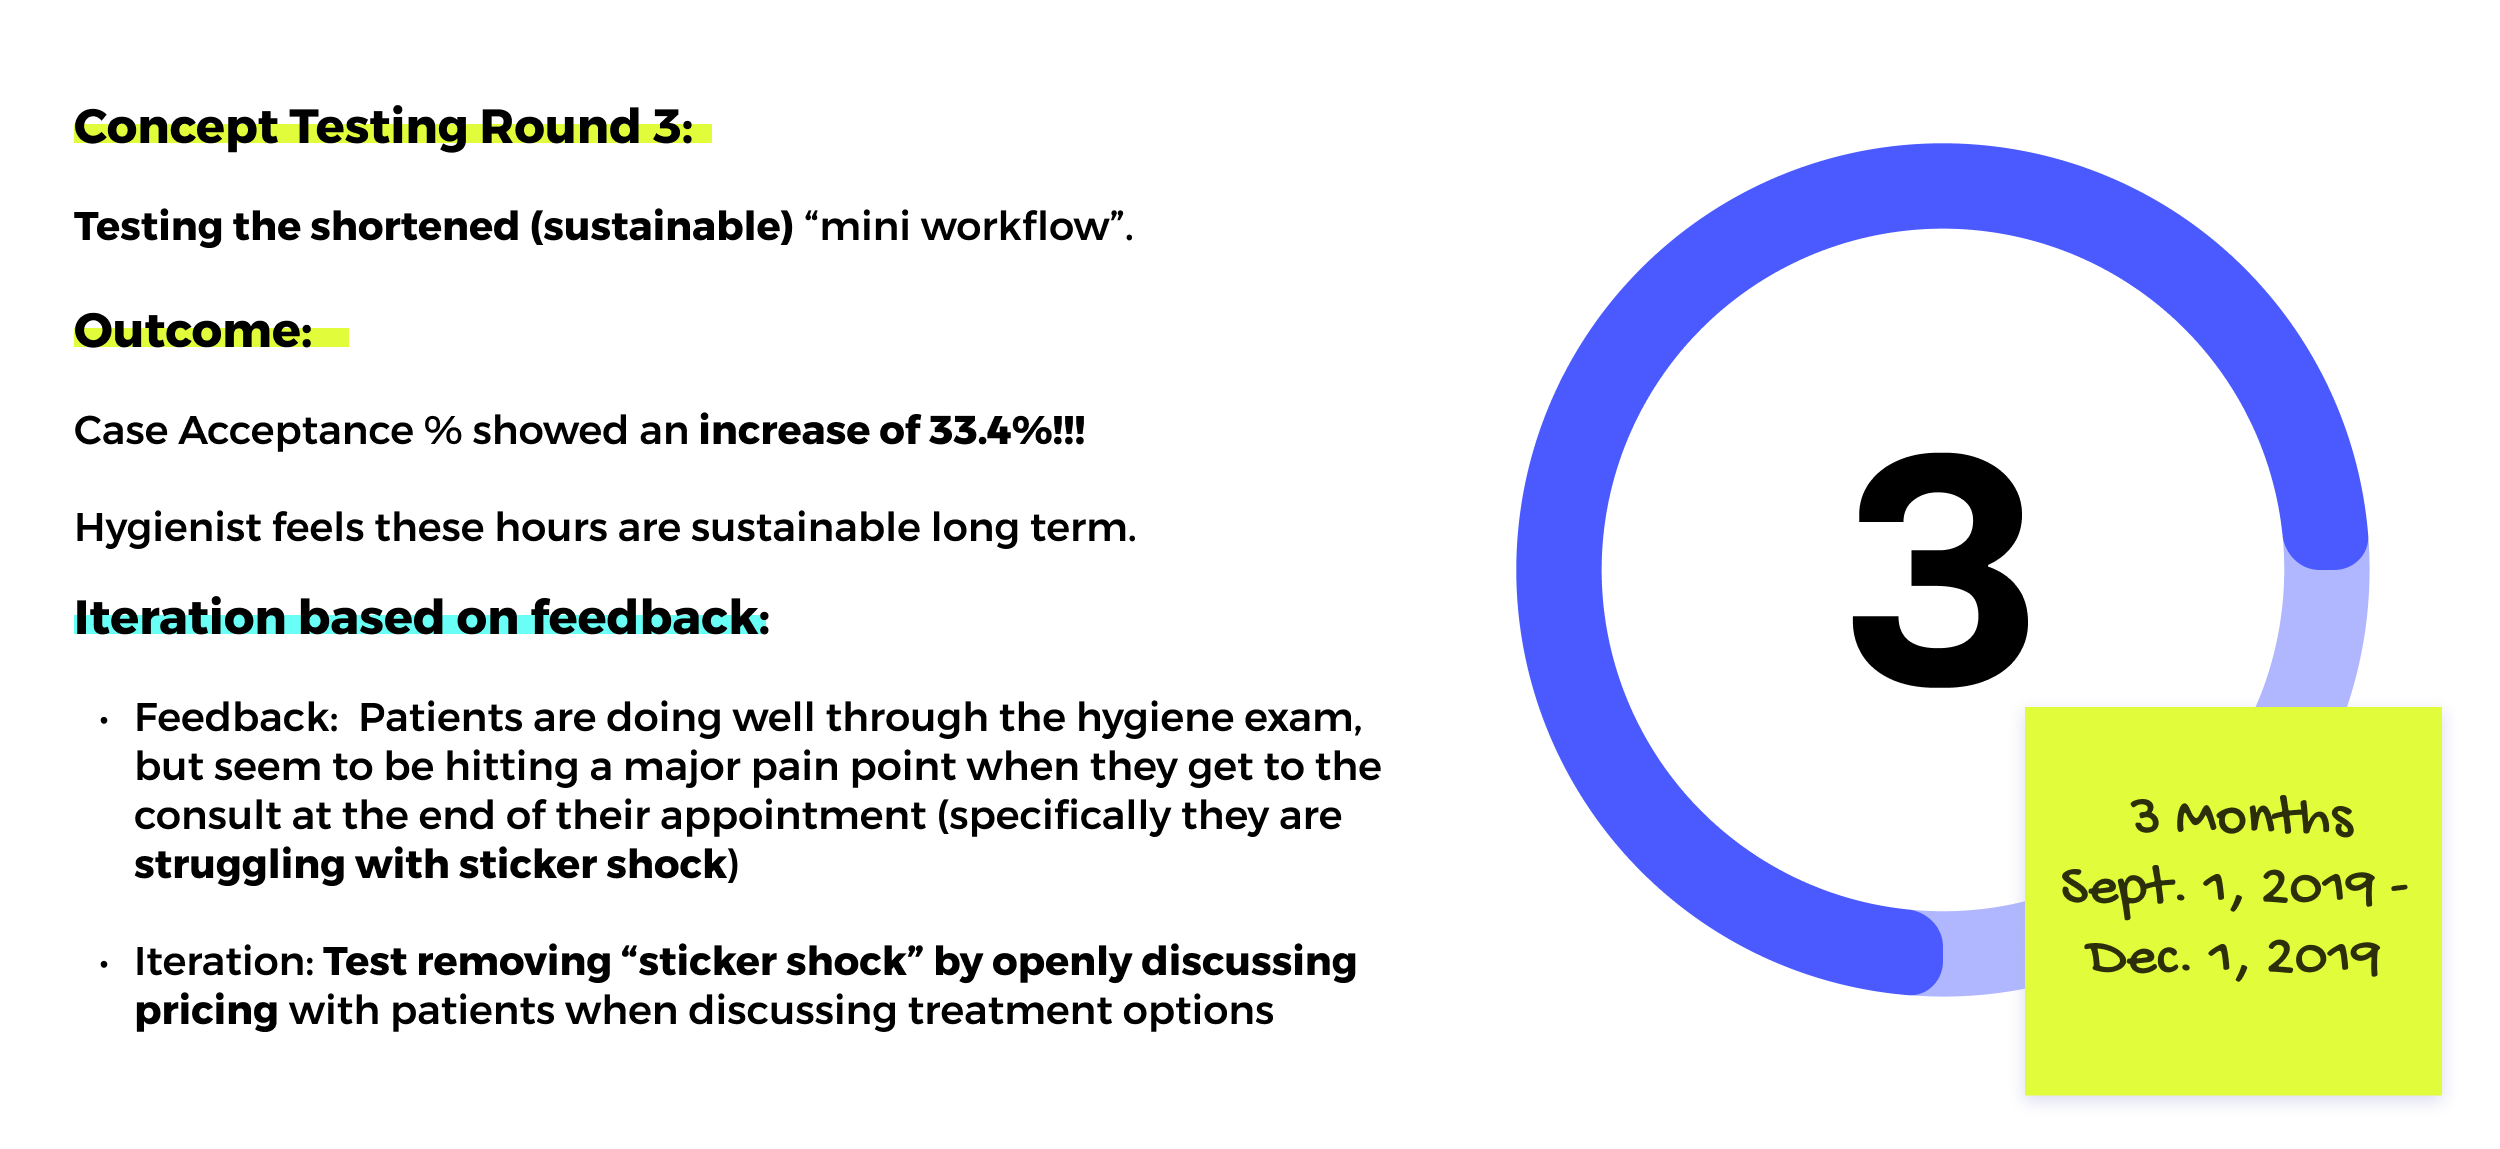
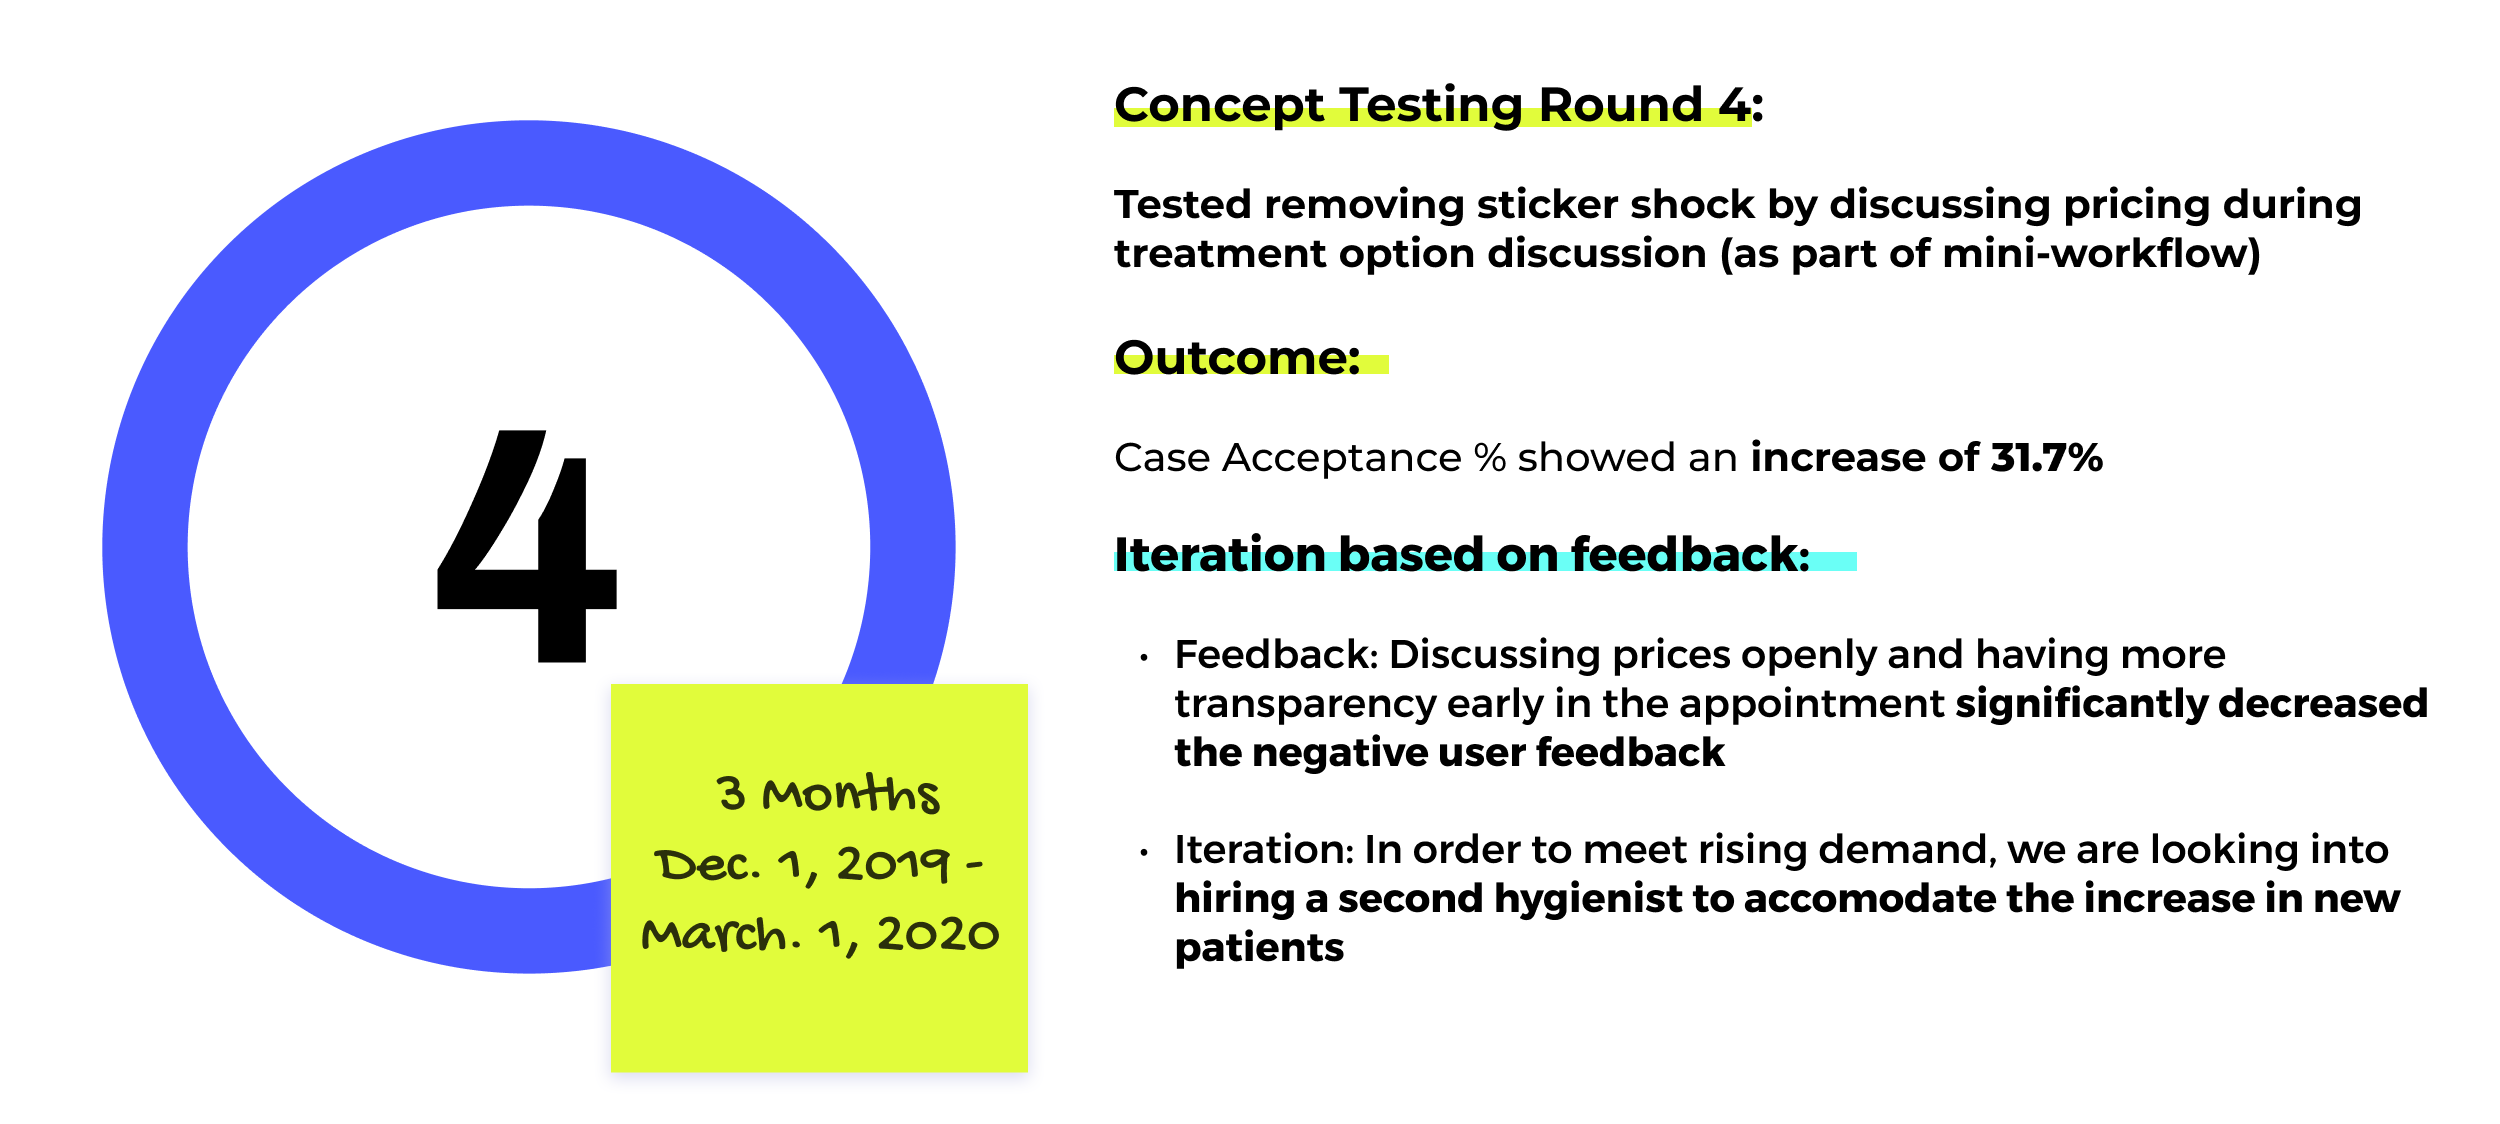
🦠 On March 13, 2020 the office closed down (temporarily) due to Covid-19 and all staff were furloughed.
This is where testing ended… but let’s take a look at the final results!
Final Results
AFTER ONE YEAR OF TESTING 🥳
RESULTS BREAKDOWNAs a result of implementing the 3 pillars (focused on improving the user experience) into the hygiene portion of the NP exam, and iterating quarterly (based on user feedback and data analysis), we were able to:
Increase the Case Acceptance Percentage from 36.3% to 57.7% (annual averages)
Increase Hygiene Revenue to $807, 745— that’s $465,217 more in revenue than the office had averaged the prior year.
Increase our Google reviews 2 full stars (4.7 stars up from 2.7 the previous year).
Month to month case acceptance %
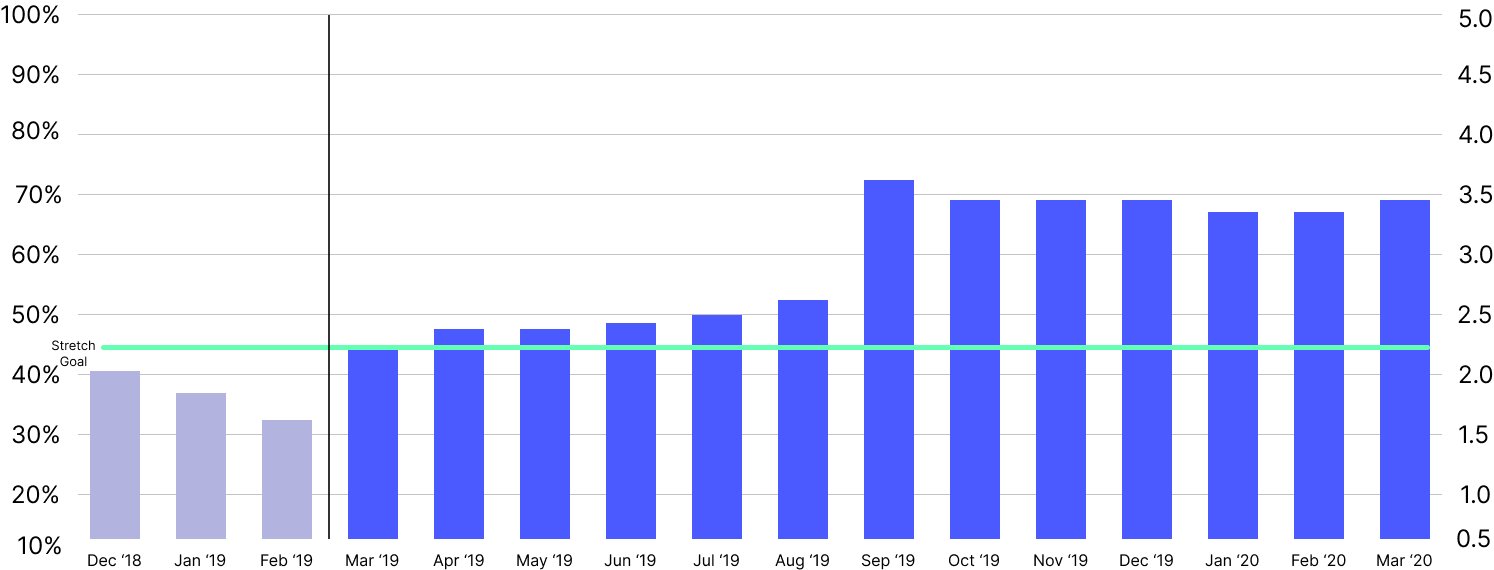
CASE ACCEPTANCE WAS AVERAGING 36.3% (2018) AND AFTER IMPLEMENTING THE PROPOSED SOLUTION AND ITERATIONS, THE AVERAGE INCREASED TO 57.7% (WITH PEAK MONTHS AS HIGH AS 70%!)Month to month hygiene revenue + ORSS
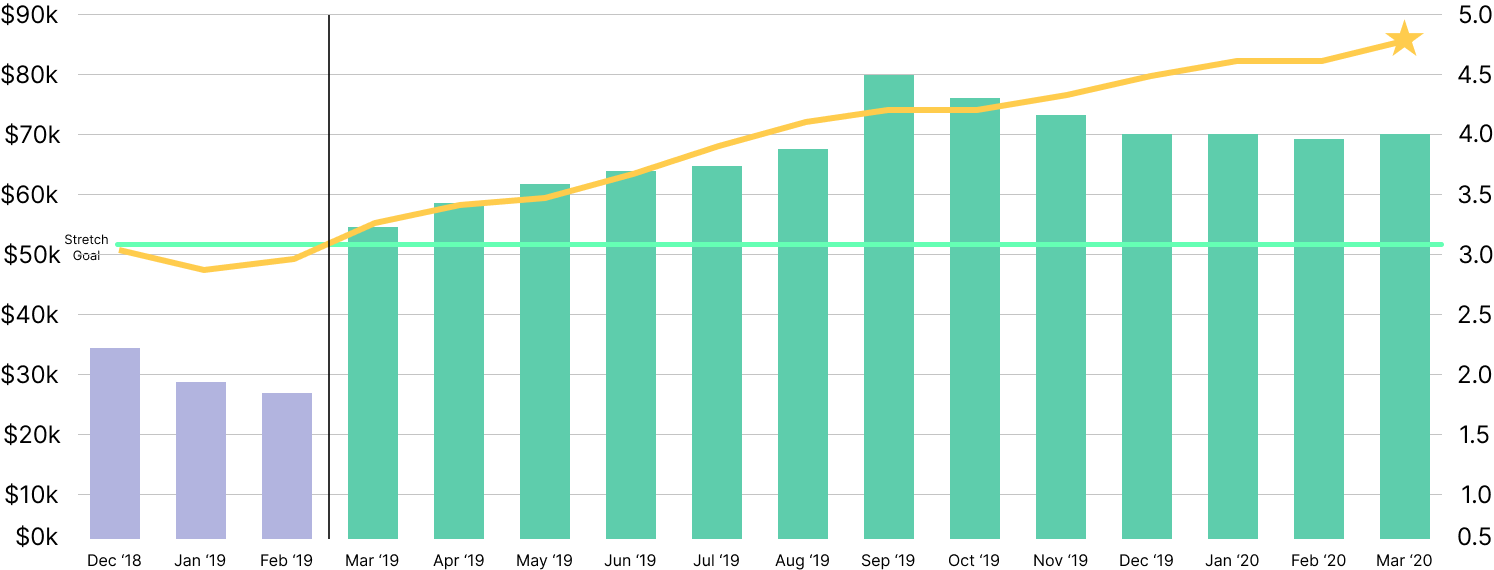
HYGIENE REVENUE ENDED UP AT $808K FOR THE YEAR (A 135% INCREASE FROM 2018 BACKCAST) AND GOOGLE REVIEW RATING WENT UP TO ALMOST A FULL 5 STARS (A 2 STAR INCREASE FROM THE START OF USER TESTING). A MOMENT OF GRATITUDE FOR MY TEAMMATES 🥰
None of these results would have been possible without the help and support of some amazing team members. I’d like to take this time to acknowledge the people that made these incredible results possible. You guys are awesome!